


You do like below. You need to calculate on LER, not on price.
The idea is to compare the present accumulation to past accumulations. If LER is higher than the average, then it is "strong"
Pascal


You do like below. You need to calculate on LER, not on price.
The idea is to compare the present accumulation to past accumulations. If LER is higher than the average, then it is "strong"
Pascal
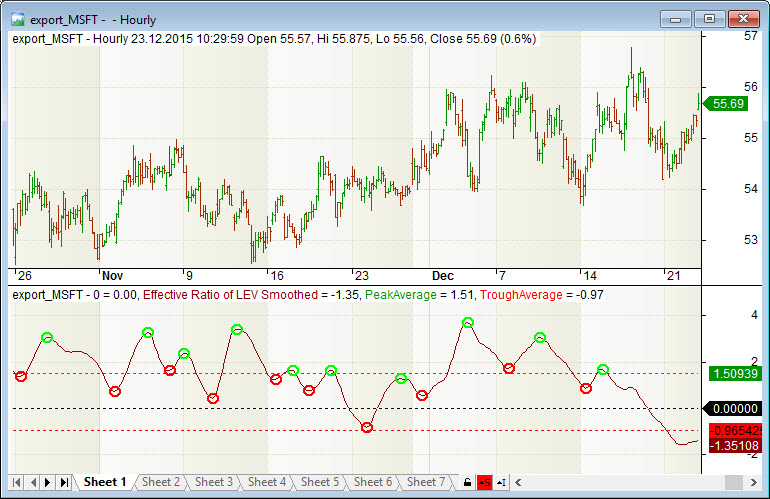
Yes, I get it. My fault, I included a price chart with zigzag indicator which has nothing to do with my calculations
What I dont understand is how you picked those peaks (you marked them red), while there are several other peaks nearby left unmarked. For example, those that I marked with green color. Does this process (of picking significant peaks) has some precise algorithm or it is totally discretional?
I just used your chart and manually pointed peaks. Surely, I missed some. The computer would not miss through.Originally Posted by rupiter

The average line is also approximate, done by hand.
Pascal
So, if I understand you correctly, all I need to do is to pick all more or less noticeable peaks and calculate the average? And the criteria what peaks I choose for calculation is fully discretionary?
Yes, that is basically it.
The average peaks is used to evaluate the current accumulation comparatively to a past average of "strong" accumulation. The result is that you know that today's accumulation is "weak", "strong" or "very strong".
You do not need an exact "line in the sand" type of method, because there is no such a thing in trading.
It is all blur and uncertain.
You'll also need to put your "accumulation" in context with the sector, the market, the fundamental elements such as earnings dates, dividends, etc... to try to see why the accumulation is strong.
Pascal
 Posting Permissions
 Reply With Quote