-
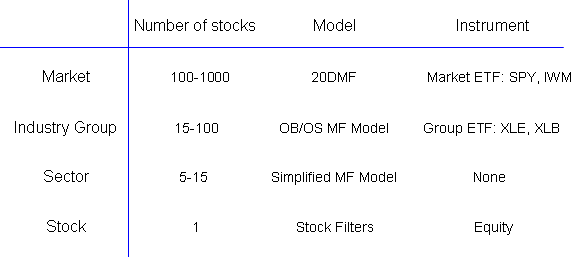
I am attaching here a general figure of the different models that are in use, but also of a back-test campaign made last week using these models.
We can see that the one level that cannot be traded is the sectors level, simply because these are sectors that I have defined myself and for which there is no instrument. These sectors are mainly used either for the 20DMF or for the stock filters.
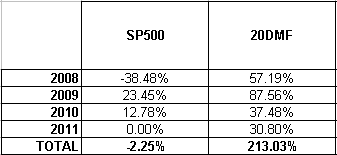
Below are the yearly returns of the S&P and the 20DMF. These are returns compounded within one year. If a 20DMF trade is overlapping two years, I separated taking one part in one year and the second in the following year. This way, we can have a better comparison.
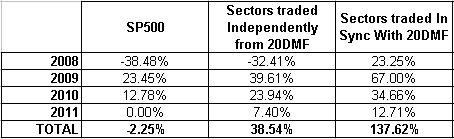
The objective of this back-test work was to measure the relevance to trade sector information.
Is it good to buy a sector when the sector issues a buy signal and short it when it issues a short signal?
The results are below. We can see that indeed, sectors trading is better than B/H on the S&P 500.
However, sectors trading in sync with the 20DMF is still better. Unfortunately, "in Sync" does not give better results than the 20DMF itself.
These results are not surprising: they are "in line" with what I had when I did a similar back-test two years ago.
My conclusion at that time was that even when a sector is flashing a buy signal, it still needs to be as close as possible from a 20DMF buy signal. The later we are from that signal, the worst the returns.
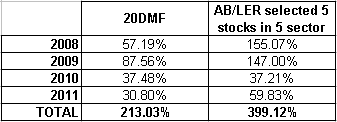
Therefore, the next idea was to select only five sectors when the 20DMF issued a signal and then from each of these sectors, get all the stocks AB/LER data and select the five stocks that were showing the best AB/LER combination. The results of such a test are shown below. These are also in line with the results I had two years ago. The table below show us that whatever efforts we can do to select specific stocks, it will be hard to beat a two time leveraged ETF that trades the 20DMF signals. Of course, specific stock trading might lead to lower DD (I did not calculate such DD.)
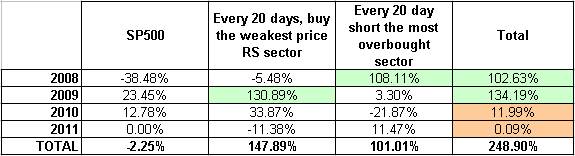
I however did another test that gives interesting results.
I selected one date in the past and decided to trade either long or short by intervals of 20 days from that date.
this means at day one, I buy the five best sectors and I sell them at day 20.
The five best sectors are those that show the weakest price RS.
On day 20, I again select the five best sectors and buy them.
On exactly the same day, I also short the five sectors that are the most overbought and I sell these positions 20 days later.
The results are shown in the table below.
We can see that this dumb strategy worked well for longs in 2009 and for shorts in 2008.
In 2010 and 2011, it did not work that well.
However, this strategy shows something important: the rotational aspect of the market. It shows that it makes sense to rotate money. This is of course obvious! I still prefer to see it in the data than not seeing it, because this means that it will probably make sense to develop a set of ETFs MF by industry groups and rotate between them.
I will now start working on these industry group MF models.
Pascal
 Posting Permissions
- You may not post new threads
- You may not post replies
- You may not post attachments
- You may not edit your posts
Forum Rules


 Reply With Quote