+ Reply to Thread
Results 1 to 9 of 9

Thread: 3-29-15 Comments

Hybrid View

  1. #1

    Market School Signals and Results

    Thank you, Mike. You obviously have an excellent grasp of all the rules. Can one still get the notifications of Market School through Leaderboard? Also, plain and simple, do you think it still works? Any results anywhere I can look at? (I realize it is stock-selection dependent, but perhaps someone has some numbers using simply an index, etc.)

  2. #2
    Join Date
    Dec 1969
    Location
    Tarzana, CA
    Posts
    962
    Quote Originally Posted by eschroeter View Post
    Thank you, Mike. You obviously have an excellent grasp of all the rules. Can one still get the notifications of Market School through Leaderboard? Also, plain and simple, do you think it still works? Any results anywhere I can look at? (I realize it is stock-selection dependent, but perhaps someone has some numbers using simply an index, etc.)
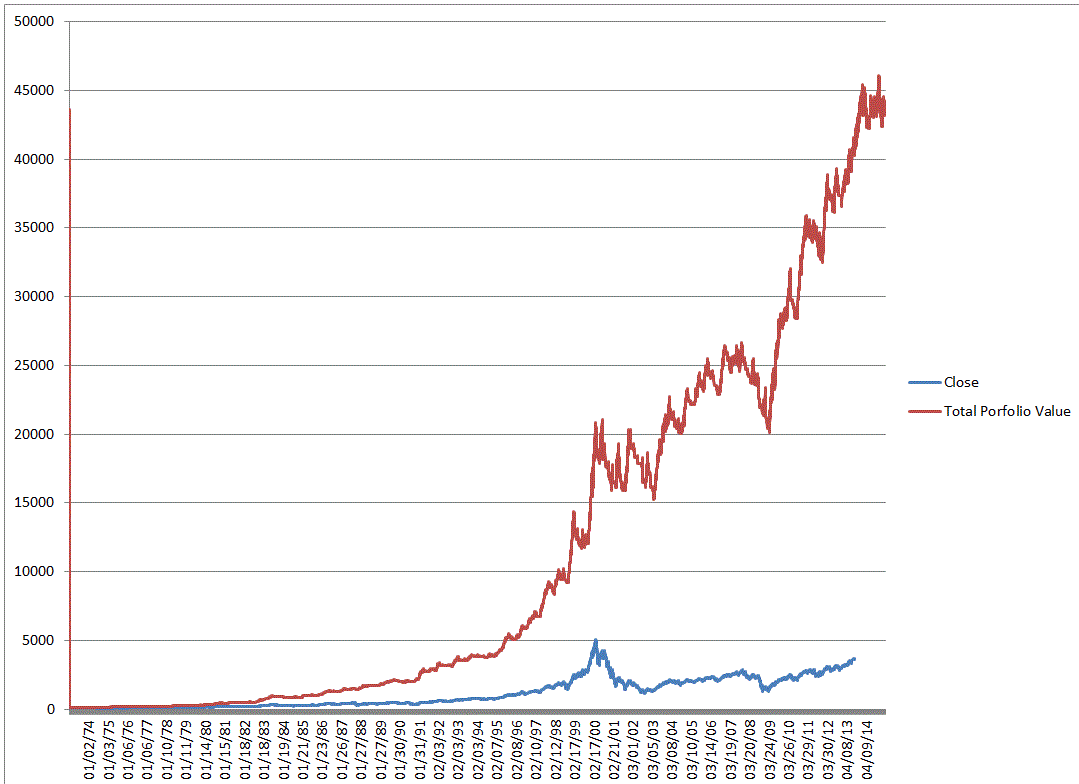
    Market School posts results of the exposure model on Leaderboard if you have attended Market School, otherwise the data is hidden from view. I presume this will continue to be the case with the upcoming home study course. The exposure model is a good guide to what you should be doing in the market and in my opinion better than I have been able to do by reading IBD or other mechanisms I have tried. As a way to measure performance I show the following chart.
    Name:  Market School Portfolio.GIF
Views: 268
Size:  28.9 KB

    The blue line represents passive buy and hold. The buy and hold strategy buys one share of the NASDAQ on 1/2/1973 at $134.63 and holds it until yesterday's close value of $4,947.44.

    The red line starts with a starting portfolio of $134.63 on 1/2/1973 (same as buy and hold) and buys the NASDAQ index at the Market School recommended exposure (0% to 100%) ending up with $43,599.19 at yesterday's close.

    The first conclusion is that timing the market can work but you should note that I have not modeled trading costs in this analysis which would reduce the performance of the exposure model (red line). Also note that you can't really buy NASDAQ shares, this is just a way to measure relative performance of two approaches using the underlying index that the exposure model is using. Also note that this is a cash portfolio analysis, judicious use of margin could increase the performance over this baseline case.

    For me the best part of the approach is what I learned about reading the market with a totally mechanical model. It is a true unbiased read of the market as the only inputs are index price and volume.
    Mike Scott
    Cloverdale, CA

  3. #3

    High Growth Stocks vlume trigger

    Mike-

    Just wondering why MNST didn't trigger today on your volume breakout screen. Marketsmith shows a volume today of 913,000 which qualifies as a 10 day pocket pivot plus price <4% above the 10 day ma and up in price. Just wondering as my HGSI charts picked it up.

    thx
    -kim

  4. #4
    Join Date
    Dec 1969
    Location
    Tarzana, CA
    Posts
    962
    Quote Originally Posted by kimmd View Post
    Mike-

    Just wondering why MNST didn't trigger today on your volume breakout screen. Marketsmith shows a volume today of 913,000 which qualifies as a 10 day pocket pivot plus price <4% above the 10 day ma and up in price. Just wondering as my HGSI charts picked it up.

    thx
    -kim
    kim,

    Volume reporting from different sources results in different numbers. One would think it would be simple to count trades but apparently not. This only makes a difference when volume is close to a threshold. The source of volume used on Pascal's site is not MarketSmith and shows end of day volume of 816,273 versus a threshold volume of 878,136 a small miss. My eSignal platform also showed a volume alert with volume of 914,317 (also different from MarketSmith).

    Another case of tiny variations in volume reporting having a large impact on trading is associated with Follow Through Days and distribution days. These are cases of looking for volume higher than the day before: different volume reporting sources coming up with different answers.

    We can't use MarketSmith in real time to answer volume questions as the volume service is 20-minute delayed, so we result to a real-time data feed. There are very few instances of a volume alert on eSignal for example not agreeing with the EV site alert. You found one of them.

    I used to fret over volume reporting being different from different providers. Now for FTDs and Distribution days I run with MarketSmith and for real-time volume vs. threshold I use the EV site or eSignal.
    Mike Scott
    Cloverdale, CA

  5. #5

    Volume Triggers

    Thanks Mike as I appreciate all the work you do especially with the High Growth Stock selections and volume trigger sites-all your comments and instructions are valued as I would like to hear you more often.

    -kim

+ Reply to Thread

Posting Permissions

  • You may not post new threads
  • You may not post replies
  • You may not post attachments
  • You may not edit your posts