+ Reply to Thread
Page 1 of 2 1 2 LastLast
Results 1 to 10 of 105

Thread: Something has changed - a while ago

Hybrid View

  1. #1
    Quote Originally Posted by PeterR View Post
    I discovered an error in my script, that calculates the future returns.

    Here are the corrected numbers:

    Attachment 36386
    (mean returns for the selected days of a TLB incl. correction for a small baseline drift up)

    Conclusions:
    1.
    Pascal's idea to use a trend-line break as an exit signal and even a short becomes more valid.

    2.
    Don't trust my coding skills or spelling :) .
    Thank you for this new data Peter.
    This means that we now count on you to post updates regarding this trendline break.


    Pascal

  2. #2
    Quote Originally Posted by Pascal View Post
    This means that we now count on you to post updates regarding this trendline break.
    ok will do :)

  3. #3

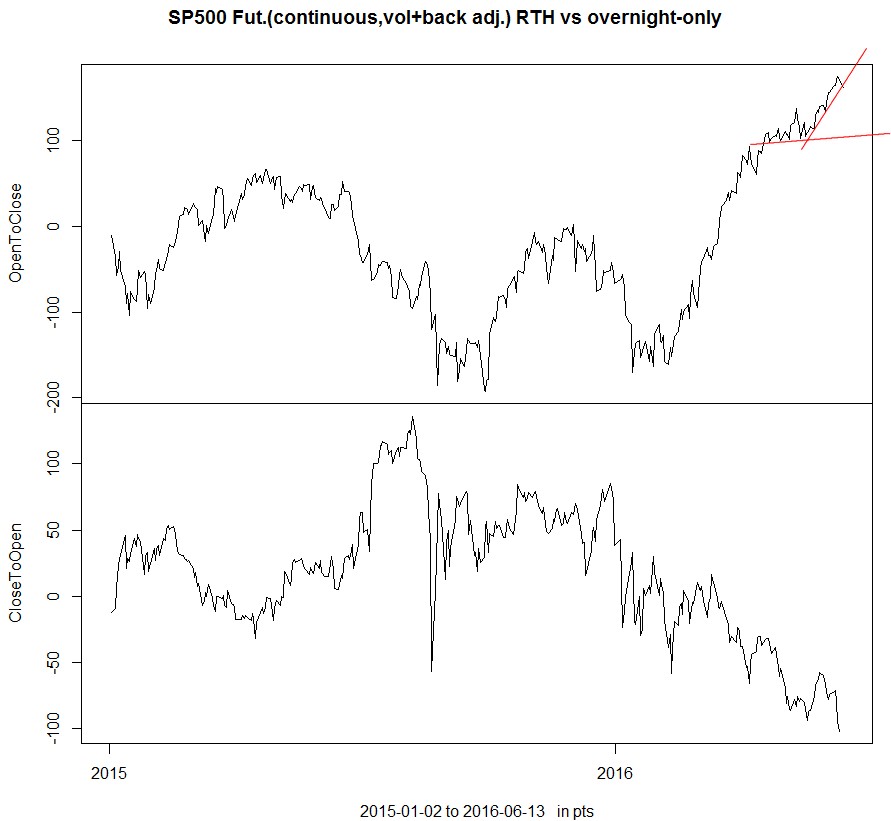
    160613 EoD

    We are at the steeper trend line.
    We had two days of RTH- selling.

    What are practical conclusions from this ?

    I would say, if one is in a short from some intraday pattern, it would be ok to hold short overnight.
    Betting that the weakness in Asia or Europe continues.

    For longer-term long positions this is not enough to close them IMO.
    Name:  2016-06-13 es ON.jpg
Views: 418
Size:  78.7 KB

  4. #4

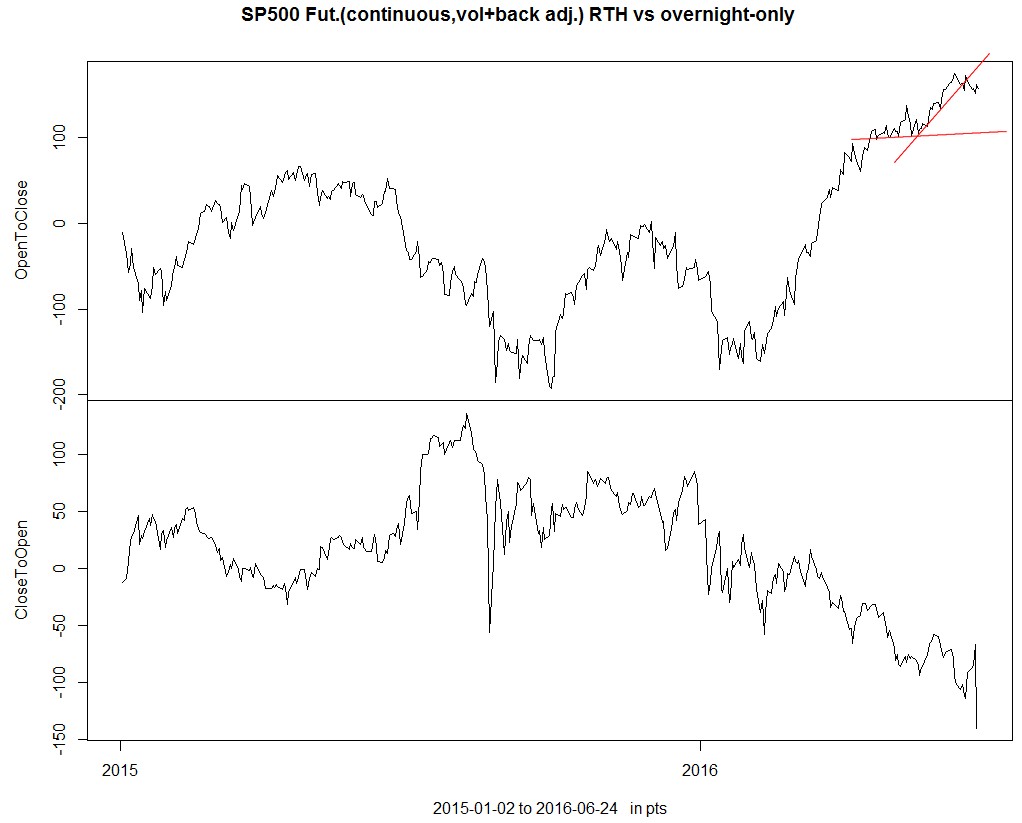
    160624 EoD

    even during the BREXIT event,
    the pattern of the strongest selling during overnight continuous.
    A more or less flat RTH.
    Name:  2016-06-24_ES ON.jpg
Views: 214
Size:  85.9 KB

  5. #5

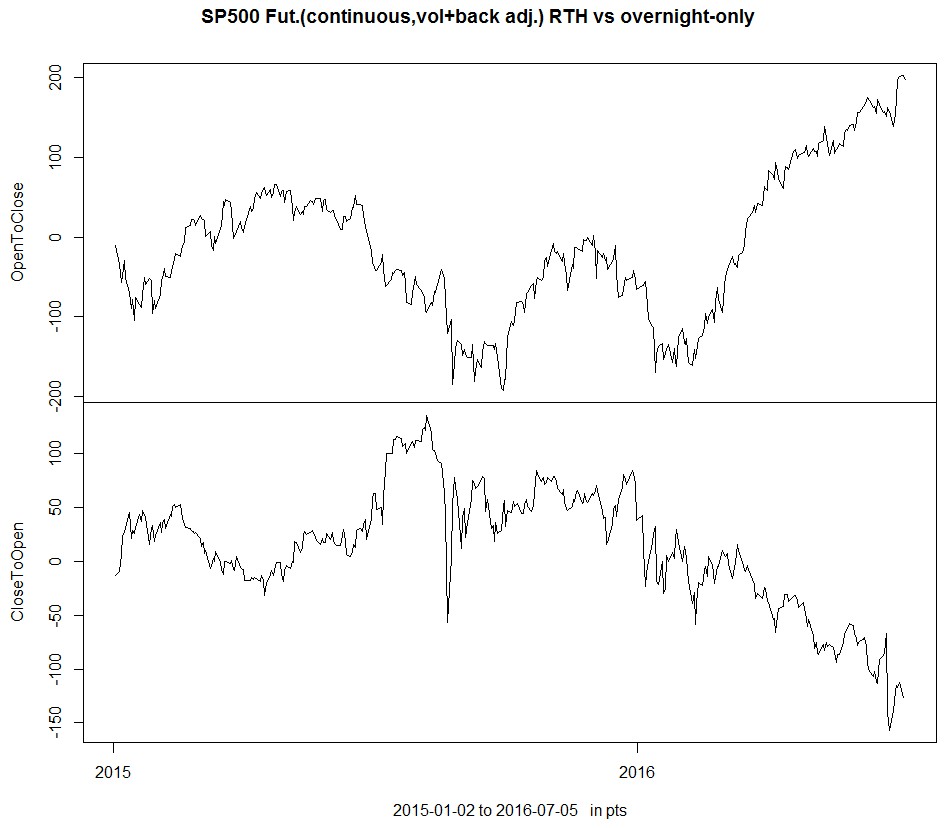
    160705 EoD

    a little selling RTH

    Name:  2016-07-05_ES on.jpg
Views: 240
Size:  78.4 KB

  6. #6

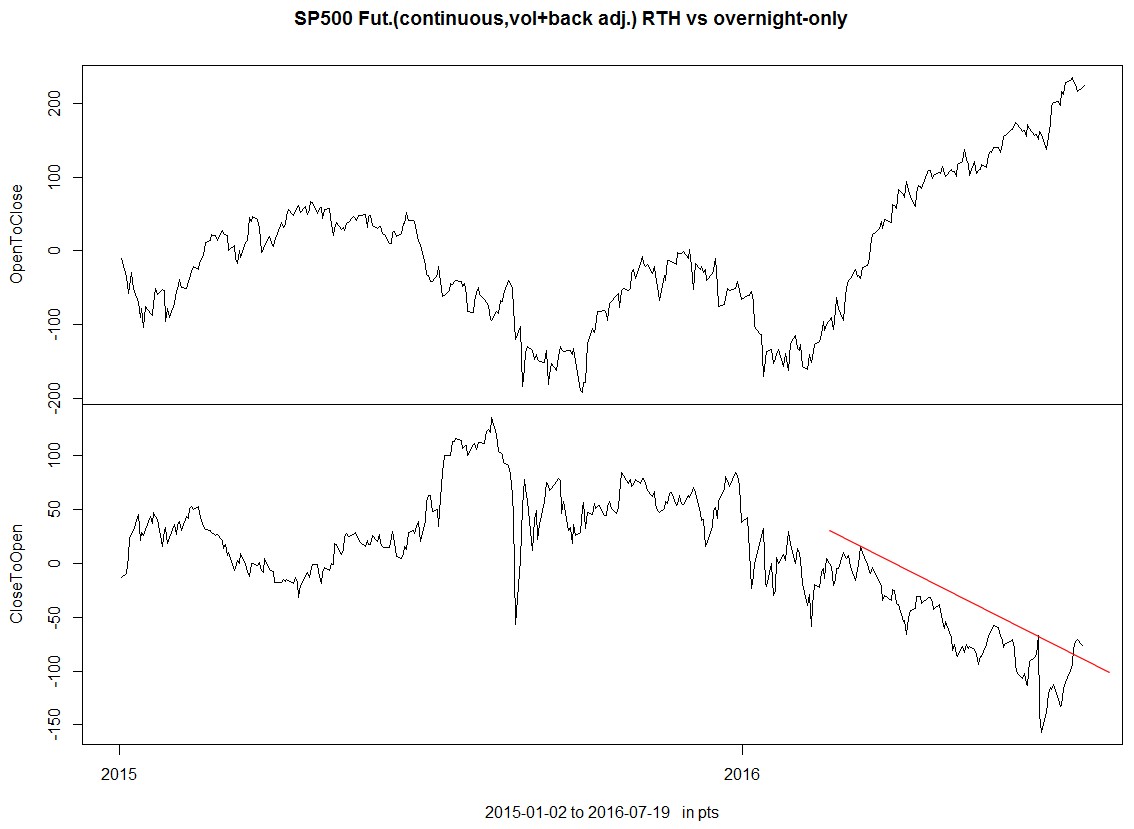
    190719 EoD

    another RTH buying session.

    and the ON selling trend might turn up.
    Name:  2016-07-19_ES ON.jpg
Views: 148
Size:  90.0 KB

  7. #7

    160803 EoD

    a RTH buying session.

    Name:  2016-08-03 ES on.jpg
Views: 171
Size:  82.0 KB

    ----
    something else:

    I came across this article by Michael Ashton.
    https://mikeashton.wordpress.com/201...r-less-mester/

    He contrasts value, momentum and carry as drivers for equities.
    As a metric he introduces 10y yield - 3month libor spread to show the carry as a factor.

    I reproduced it as a ratio (not the right spreads on stockchart)

    Name:  2016-08-04_10yLibor3.jpg
Views: 173
Size:  160.5 KB

    according to this, carry is not a strong factor currently.
    ... or carry has less impact on (long) positions
    Last edited by PeterR; 08-05-2016 at 01:59 AM.

  8. #8

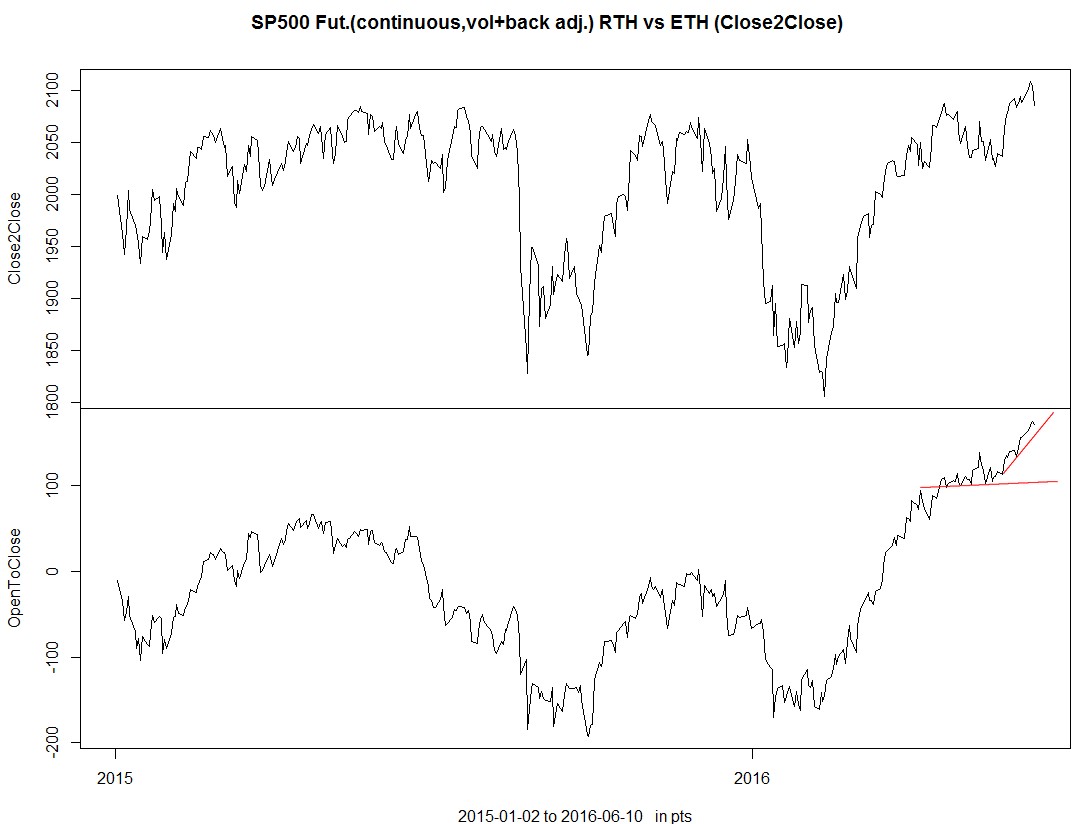
    160610 EoD

    The gap down, caused in Asia and Europe , makes today look severe on a normal chart (upper panel).

    On the RTH-only chart it is barely visible.

    (I made the scale bigger to see the details better.)
    Name:  2016-06-10_ES ON.jpg
Views: 413
Size:  93.2 KB

  9. #9

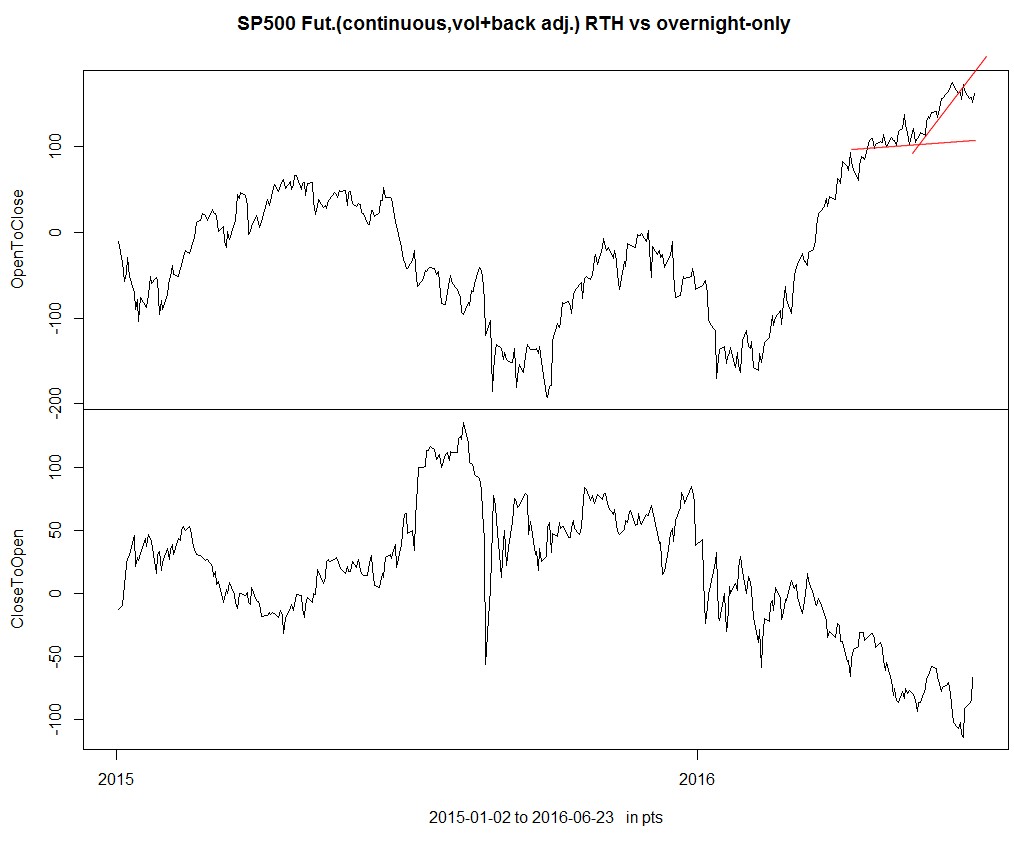
    160623 EoD

    some buying rth
    before the strong selling during BREXIT.
    Name:  2016-06-23_es on.jpg
Views: 356
Size:  82.4 KB

  10. #10

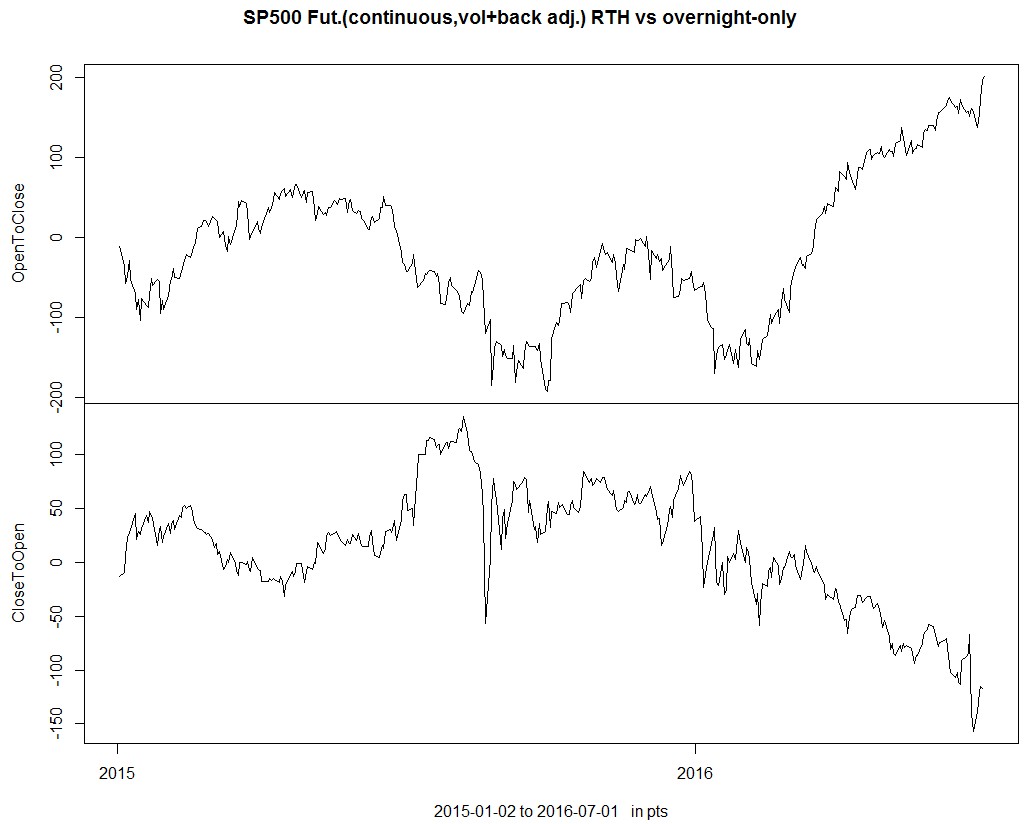
    160701 EoD

    a 4th RTH buying session.

    Name:  2016-07-01 ES ON.jpg
Views: 234
Size:  81.5 KB

+ Reply to Thread

Posting Permissions

  • You may not post new threads
  • You may not post replies
  • You may not post attachments
  • You may not edit your posts