Good find Dave! and Good question!
This is a pretty good question indeed!
There was an evolution between December and now: the IWM robot has been developed.
How did this affect the 20DMF method? In two ways:
1. When I developed the IWM robot and looked at the statistics, I noted that when the OB/OS indicator was extremely negative (below -90), we always experienced a reversal in the next days. This basically meant that pressing on a short in such conditions was not a good idea. I thus inserted that specific condition on the 20DMF: cover shorts when OB/OS reaches -90.
2. I then had a long thought about the "porosity" parameter that was set in the 20DMF. This parameter's intention is to avoid whipsaws when the indicator barely crosses a certain level and then reverses back. The porosity parameter says that the level must be crossed by a certain arbitrary level. The porosity parameter has a noble element though: it avoids the whipsaws effect in ill-timed trading decisions. This is positive when the 20DMF is used as a stand alone indicator. However, when it is used as an element of another indicator (such as the Robot), then the porosity parameter has a negative effect: it masks or delays to communicate the information that we have crosses some level. Since the 20DMF is handing the trade decision to the robot, I decided to limit the porosity parameter as much as possible and let the robot use the 20DMF together with his other indicators - and the associated statistic tables and the floor levels - to take trading decisions that were closer to the market.
The consequence is that indeed, the 20DMF as part of the robot produces more trades than the 20DMF when it was stand alone, and also produces lower returns (As a reference, the stand alone 20DMF generated 30 trades until Dec 15, 2001, for a total SPY return of 316%, while the actual 20DMF generated 36 trades during the same period, for a return of 291% as of January 28, 2011.
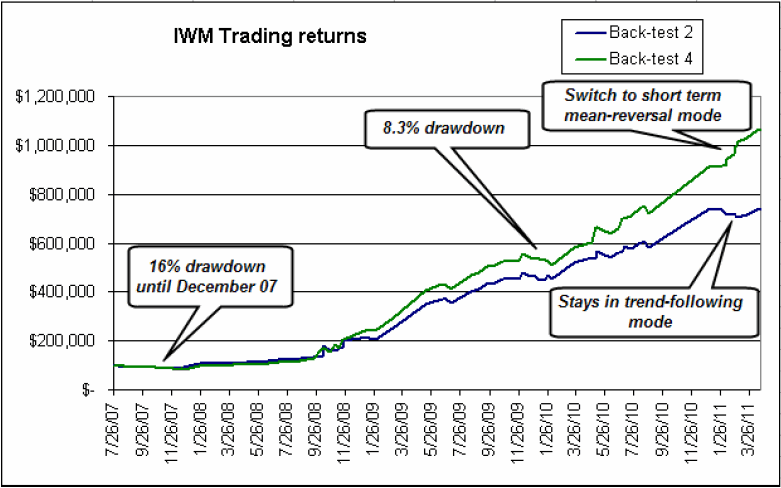
However, you can see below (first figure) the IWM returns using the multi time frame pivots and the stand alone 20DMF, compared to the Robot IWM return (second figure). The difference is very obvious.
Pascal


 Reply With Quote