


Not sure if this is the "obvious" to which you refer, but there were a string of large winning trades that would have been missed at the beginning of the 2009 bull...just a few weeks after the QE1 announcement.Originally Posted by Pascal


Not sure if this is the "obvious" to which you refer, but there were a string of large winning trades that would have been missed at the beginning of the 2009 bull...just a few weeks after the QE1 announcement.
The purpose of a model is not only to maximize reward but to optimise the reward to risk ratio. Higher losses could offset that ratio even with slightly improved reward.
Look like this filter is used to identify the short covering activity by setting a threshold for ATR. Is this filter ATR - average(ATR) ??
Last edited by mingpan.lam; 10-31-2011 at 05:25 PM.
Ellis,
I measure average profit over maximum drawdown, rather than average to average. The problem with volatility is the human element -- there's only so much pain I can handle. :-)
Tim
Thks Tim.
Very true. Something the backtest result is good but when the drawdown happens, you feel the pain !!

Exactly! Then, the second obvious issue is that the great majority of the LT/ST conflicts are on "buy" signals.
It means that the IWM robot had conflicting situations on buy signals, especially at the start of QE1 and also in the past weeks. The common points between these two periods is the high volatility. High volatility is linked to fear and to better shorting opportunities. Hence, the IWM Robot does not see that at specific points in the market life, high volatility was a consequence of forced shorts covering.
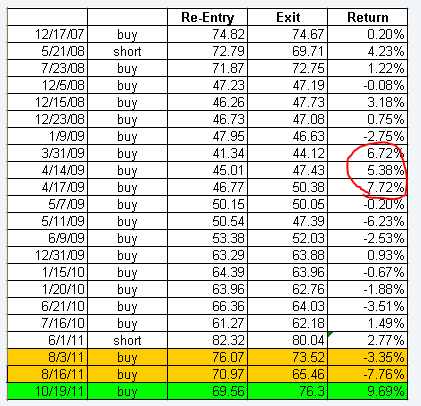
We can see in the list below - from which I erased the short signals - that the average ATR is 3.43% this is 1% higher than the average ATR for the past 5 years. This confirms that there is a volatility interpretation issue.
The question is now: how can we build a filter that would sort out the bad red trades and keep the good green trades. This is where I'd go to Andrei and ask if he has in his tool box some sort of indicator that can do such a job.
I found such a filter and used it to build another column.
I then sorted the results, seprating the positive from the negative of this new filter.
I believe that we now have an improvement over the existing IWM Robot, that takes care of Buy signals in high volatility environments.
Pascal
My answer would be, that honestly I have no idea! But I see that you found such a filter... So, what is that column to the right?
Great job, Pascal!
Regarding measuring risk/reward of a system: Maximum drawdown is not a very good measure for system risk. Also it is not a good predictor for future drawdown. There is math logic behind the popular saying "the worst drawdown of a system is yet to come".
We look at backtests trying to get an estimate for a system's future behavior with an underlying assumption that the statistical characteristics will remain the same. But the maximum drawdown is not a good representation of the statistical distribution of trade results; it expresses just a single path of trade that occured up to this point.
A simple example: The following trade results could come from two systems with similar statistical characteristics:
A. +2 -3 +2 -1 +2 -2 +1
B. +2 -2 -3 -1 +2 +2 +1
In evaluating the potential risk of a system, measures that look at the statistics of trade results and not a single path would be more predictive. Downward Deviation, or Downward Deviation of rolling periods would be a much better measure for system's risk. Sortino, or even Sharpe Ratio would give a better prediction for future system risk adjusted return than (past profit) / (maximum drawdown).
The issue with ATR is that it is un-directional. So what we need is simply to get the direction back into ATR or at least have an indicator that separately produces the ATR direction.
Standard Wyckoff or Larry Williams indicators usually say that when the price finishes at the top half of its day range, this is a positive sign of accumulation. The idea is simply, instead of using the day's range, to take the day's true range, get the mid-point and calculate the ratio of the difference between the close and the mid-point to the mid point. (Close-Midpoint)/Midpoint. This small formula gives you a directional strength of the true range. What I do is then calculate the 20EMA of that value. if it is negative then the buy trade cannot restart when the LT/ST conflicts stops. Otherwise, it can restart.
Pascal
 Posting Permissions
 Reply With Quote