-
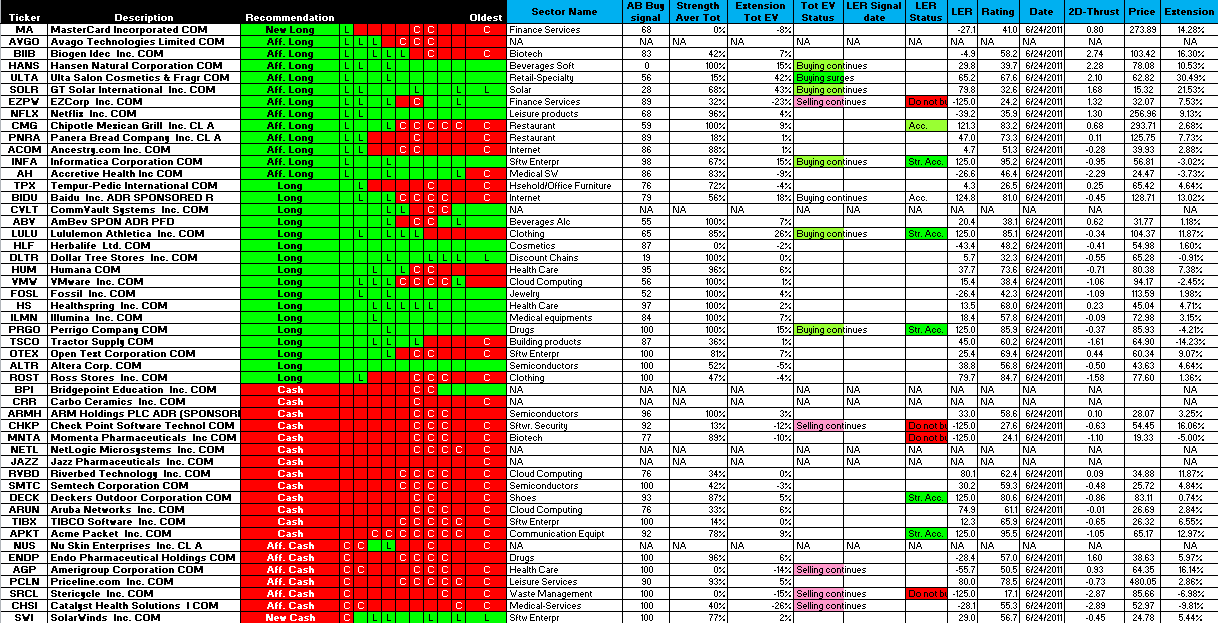
IBD50 through the GGT+EV Lens, 11JUN24 Close Data
Here's the latest snapshot of the IBD50:
Here's an Excel file that you can manipulate:
IBD50-11JUN24close.zip
Relatively unimpressive set of 50 stocks, in my opinion. There are diamonds in the coal that are near support levels, which is encouraging IF the support levels hold, but if support fails then this list will turn further downward.
Before you leap:
- review the movie that I created and which Pascal has made available on using buy sectors and stocks within those buy sectors
- check the sector/group EV, and ensure that you're seeing an influx of money flow to the sector/group
- check the AB % level in the individual chart that Pascal provides. If the AB level is not increasing (becoming less negative), e.g., if a short-term slope is not pointing upward, then pass on the stock.
- check the 2d thrust, and ensure that money flow into the stock is positive, not negative
Some testing that I do, that is not discussed here, is showing that on rallies, that the market is favoring stocks with poor GGT ratings as well as poor EV ratings, ostensibly due to short covering and shorting the rallies. Keep a list of IBD stocks that are getting pummeled, as well as those that are holding up well.
Let's hope for a good week due to anticipated window dressing of the month, quarter, and semiannual periods.
Regards,
pgd
Last edited by grems8544; 06-27-2011 at 07:24 AM.
 Posting Permissions
- You may not post new threads
- You may not post replies
- You may not post attachments
- You may not edit your posts
Forum Rules


 Reply With Quote