+ Reply to Thread
Results 1 to 10 of 28

Thread: 20dmf rt

Hybrid View

  1. #1

    What time frame are you looking for 1 higher lows and 2 higher highs (if long)?

    Quote Originally Posted by Billy View Post
    Nickola,

    When initial stops on the 2/3 TNA/TZA positions are not hit, I wait for one higher low and two higher highs (if long). I draw a Fibonacci retracement grid from the first low preceding the higher low to the higher high and keep updating the Fibonacci grid if new highs are made. I have a trailing stop for 1/3 of TNA at a 39% retracement (failure of the 38.2% Fibo level) and another trailing stop for 1/3 of TNA at a 51% retracement (failure of the 50% Fibi level). The Fibonacci computations are made on TNA/TZA, not on IWM.

    Billy
    Hi Billy,

    Are you looking at 30-min (or shorter?) bars to find the 1 higher low and 2 higher highs?

    Thanks,

    Shawn

  2. #2
    Join Date
    Dec 1969
    Location
    Brussels, Belgium
    Posts
    1,999

    Last Trade Example

    Quote Originally Posted by shawn_molodow View Post
    Hi Billy,

    Are you looking at 30-min (or shorter?) bars to find the 1 higher low and 2 higher highs?

    Thanks,

    Shawn
    Yes Shawn, 30-minutes chart seems to work best.

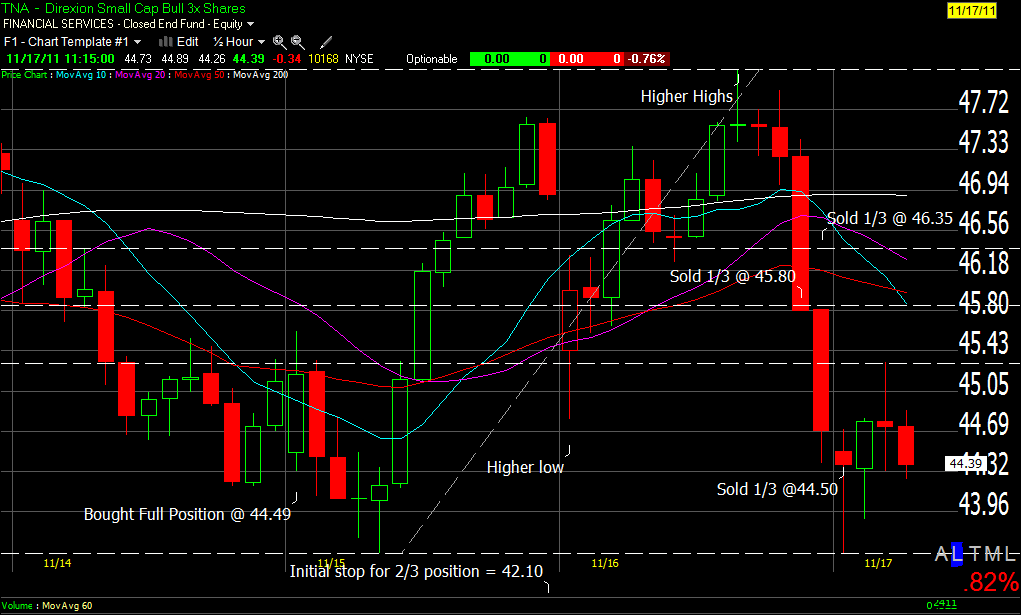
    Here is what I did on the last long robot trade that lasted only 2 days (from open 11/15 to open11/17). It was basically a flat trade with the entry and the exit being only 1 cent away from each other.
    But I could make a small + 2.38% gain scaling out of TNA as explained in my prior post.

    Like the robot, I bought a full TNA position at the open at 44.49.
    My stop on 1/3 of the position will always be the same as for the robot.
    My initial stop on 2/3 of the position was 0.2% below the first support cluster at 42.10.
    The stop is not hit. On 11/16 at 2:00 pm, the pattern of a higher low and higher highs is completed and I draw my Fibonacci grid. I enter hard stop orders for 1/3 position at 46.35 (39 % retracement) and 45.80 (51% retracement). They are hit before the close.

    The last 1/3 position is exited with the robot signal change at the open the next morning on 11/17. If it had not been the case (no signal change), I would have entered a new limit buy order for the proceeds of the 2/3 position at the robot recommended price for 11/17.
    Billy

    Name:  Last Trade.gif
Views: 343
Size:  32.1 KB

  3. #3

    A Follow-Up Q re: Initial Stops on 2/3rd Position

    Hi Billy,

    Thanks for the excellent explanation.

    I am interested in potentially trying your approach, so I have tried to see if I could re-create the various aspects of the trade.

    I am struggling with the first support cluster and related initial stop on the 2/3 position. I went back to the Forum Clusters 111115 file you published before the open on Nov 15, and I see the first support cluster on IWM as 70.36 to 72.63. Accordingly, the bottom of the first support cluster on IWM at 70.36 is 3.5% below the Nov 15 open of IWM (72.92).

    Your above note seems to say that your TNA stop at 42.10 was +0.2% below first support cluster on TNA - this is only 5.4% below the TNA open at 44.49. I would have thought there would be more like an approximately 3X % difference between the IWM and TNA stops, i.e. the bottom of the first support cluster on TNA more like in the area of 3.5%*3 = 10.5% below the Nov 11 TNA open??

    If I traded TNA based on IWM price triggers (which I can do in my IB account), than an IWM trigger just below 70.36 (the first support cluster bottom) would have resulted in a lower TNA price than 42.10, perhaps in the range of $40 and exposed such a trade to about twice the downside risk you are describing.

    What am I missing?

    Thanks,

    Shawn
  4. #4
    Join Date
    Dec 1969
    Location
    Brussels, Belgium
    Posts
    1,999
    Quote Originally Posted by shawn_molodow View Post
    Hi Billy,

    Thanks for the excellent explanation.

    I am interested in potentially trying your approach, so I have tried to see if I could re-create the various aspects of the trade.

    I am struggling with the first support cluster and related initial stop on the 2/3 position. I went back to the Forum Clusters 111115 file you published before the open on Nov 15, and I see the first support cluster on IWM as 70.36 to 72.63. Accordingly, the bottom of the first support cluster on IWM at 70.36 is 3.5% below the Nov 15 open of IWM (72.92).

    Your above note seems to say that your TNA stop at 42.10 was +0.2% below first support cluster on TNA - this is only 5.4% below the TNA open at 44.49. I would have thought there would be more like an approximately 3X % difference between the IWM and TNA stops, i.e. the bottom of the first support cluster on TNA more like in the area of 3.5%*3 = 10.5% below the Nov 11 TNA open??

    If I traded TNA based on IWM price triggers (which I can do in my IB account), than an IWM trigger just below 70.36 (the first support cluster bottom) would have resulted in a lower TNA price than 42.10, perhaps in the range of $40 and exposed such a trade to about twice the downside risk you are describing.

    What am I missing?

    Thanks,

    Shawn
    Shawn,
    You are correct. There was a typo in my journal notes and the initial stop was 40.10. Thank you for noticing and for the feedback.
    Billy

+ Reply to Thread

Posting Permissions

  • You may not post new threads
  • You may not post replies
  • You may not post attachments
  • You may not edit your posts