+ Reply to Thread
Results 1 to 10 of 27

Thread: Coding the Active Boundaries indicator

Hybrid View

  1. #1
    I think that what you are asking is technically too difficult for non-developers to come up with an easy response.
    The AB calculation is similar to a VWAP calculation. A VWAP uses the Volume to calculate the average price. (Volume weighted Average price.) AB also needs to use the number of shares that were exchanges at each price level: this is also a volume weighted average price and not a simple average price.

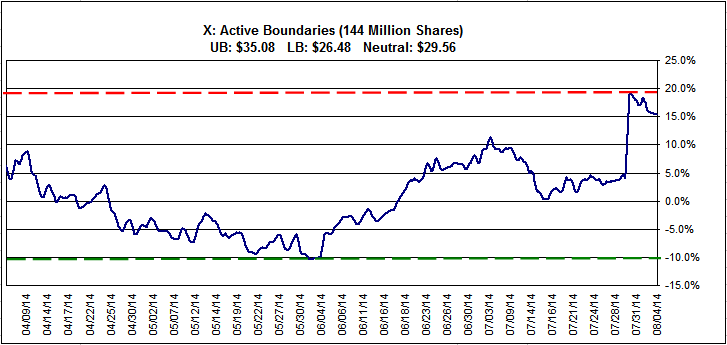
    Below is the minute data for the company X and the Active Boundaries graph as of last night.
    The best is that you try your different ideas and see which comes close to the pattern below.
    The, the answer will be obvious.


    Pascal

    Name:  X.gif
Views: 1787
Size:  12.3 KB
    Attached Files
    Last edited by Pascal; 08-05-2014 at 04:49 AM. Reason: Typos

  2. #2
    Join Date
    Mar 2013
    Location
    Reggio Emilia, Italy
    Posts
    24
    Pascal,

    thank you very much for your support. The txt file and the plotted AB is what I need in order to have a reference for my developement.

    I will study the WVAP in details and will try to code the AB.

    Regards,

    Alberto

  3. #3
    Join Date
    Mar 2013
    Location
    Reggio Emilia, Italy
    Posts
    24
    Quote Originally Posted by Pascal View Post
    I think that what you are asking is technically too difficult for non-developers to come up with an easy response.
    The AB calculation is similar to a VWAP calculation. A VWAP uses the Volume to calculate the average price. (Volume weighted Average price.) AB also needs to use the number of shares that were exchanges at each price level: this is also a volume weighted average price and not a simple average price.

    Below is the minute data for the company X and the Active Boundaries graph as of last night.
    The best is that you try your different ideas and see which comes close to the pattern below.
    The, the answer will be obvious.


    Pascal

    Attachment 25307
    Hi Pascal,

    I am working in coding the Active Boundaries, and in order to accomplish it as more correct as possible, I am asking if it is possibile to have the output of the Active Boundaries for the X company as from your previous graph.

    This would help a lot.

    Thanks

  4. #4
    Join Date
    Mar 2013
    Location
    Reggio Emilia, Italy
    Posts
    24
    It seems I have been succesfull with my Java implementation for the Active Boundaries indicator

    Name:  ZA818.png
Views: 977
Size:  60.7 KB


    Although your result it is smoother than mine (do you smooth the AB with EMA or any other filter?), the overall path seems quite similar


    Name:  ZA819.png
Views: 987
Size:  62.2 KB

    I am using the second method you propose at pag.110

    Thanks

  5. #5
    Join Date
    Dec 1969
    Location
    New Jersey
    Posts
    189
    Congrats acepsut!

    Harry

  6. #6
    Join Date
    Mar 2013
    Location
    Reggio Emilia, Italy
    Posts
    24
    Quote Originally Posted by Harry View Post
    Congrats acepsut!

    Harry
    Thanks Harry.

  7. #7
    Join Date
    Dec 2013
    Location
    Poland
    Posts
    11

    Effective Volume indicator

    Hi Pascal,

    i'm also working on the indicators from your excelent book 'Value In Time'. Would be possible to get a picture of Effective Volume of minute data for the company X for the comparison purpose. I would be very greatfull.

    Thanks

    Jarek

    Quote Originally Posted by Pascal View Post
    I think that what you are asking is technically too difficult for non-developers to come up with an easy response.
    The AB calculation is similar to a VWAP calculation. A VWAP uses the Volume to calculate the average price. (Volume weighted Average price.) AB also needs to use the number of shares that were exchanges at each price level: this is also a volume weighted average price and not a simple average price.

    Below is the minute data for the company X and the Active Boundaries graph as of last night.
    The best is that you try your different ideas and see which comes close to the pattern below.
    The, the answer will be obvious.


    Pascal

    Attachment 25307

  8. #8
    Join Date
    Aug 2016
    Posts
    2
    Quote Originally Posted by jagin View Post
    Hi Pascal,

    i'm also working on the indicators from your excelent book 'Value In Time'. Would be possible to get a picture of Effective Volume of minute data for the company X for the comparison purpose. I would be very greatfull.

    Thanks

    Jarek
    do you have the codes for all the indicators yet(LEV , Active Boundaries)?

+ Reply to Thread

Posting Permissions

  • You may not post new threads
  • You may not post replies
  • You may not post attachments
  • You may not edit your posts