+ Reply to Thread
Results 1 to 10 of 16

Thread: 6-15-2012 After the Close

Hybrid View

  1. #1
    Join Date
    Dec 1969
    Location
    Brussels, Belgium
    Posts
    1,999
    Quote Originally Posted by mscott View Post
    Billy you bring up an interesting point. The composition of the IBD 6000 has changed over the period of my analysis. The addition of ETFs has been prolific. My testing has relied on printed IBD6000 data. I can't backtest a different historical subselection of index data as the older data isn't available to me so need to watch this in the future. The thresholds for IBD6000 %E would probably change if different data were used. I don't know if 11.79% would be high or low...
    If it can help you, I keep track of the ratings only for stocks with composite ratings since 2/7/2011. See attached file which you can easily update going forward. These are also the numbers I am using for my correlation research for IWM.

    Billy
    IBDAccDistCompRatings Only.xlsx

  2. #2
    Quote Originally Posted by Billy View Post
    If it can help you, I keep track of the ratings only for stocks with composite ratings since 2/7/2011. See attached file which you can easily update going forward. These are also the numbers I am using for my correlation research for IWM.

    Billy
    Attachment 14721
    Thanks Billy!

    Is it possible to get this data with the IBD subscription or only with MarketSmith?

    Thanks in advance,

    Martin

  3. #3
    Join Date
    Dec 1969
    Location
    Brussels, Belgium
    Posts
    1,999
    Quote Originally Posted by mnoel View Post
    Thanks Billy!

    Is it possible to get this data with the IBD subscription or only with MarketSmith?

    Thanks in advance,

    Martin
    Marketsmith is necessary. It allows you to download daily data with all your criteria filters, but unfortunately not past data and ratings.
    Billy

  4. #4
    Thanks Billy. It's unfortunate that historical data are not accessible.

    Regards,

    Martin

  5. #5

    June performance in election years

    Mike,

    Have you parsed out historical returns for June in election years only? See link below:

    http://www.ritholtz.com/blog/2012/05...lection-years/

  6. #6
    Join Date
    Dec 1969
    Location
    Tarzana, CA
    Posts
    962
    Quote Originally Posted by adam ali View Post
    Mike,

    Have you parsed out historical returns for June in election years only? See link below:

    http://www.ritholtz.com/blog/2012/05...lection-years/

    Adam, I have parsed the election years. Pardon the unformated list below which is every rally that began in an election year in my database. Missing here will be any rally that began the year before and carried into an election year. There are plenty of rallies that started earlier in the year and carried into June for good gains. There just aren't any that entered June in a correction and began a healthy ascent.

    Date (length of raly days) Percent Gain
    1/6/1976 ( 67) 10.70%
    4/20/1976 ( 21) -1.50%
    6/17/1976 ( 46) -0.10%
    9/1/1976 ( 21) -0.20%
    11/4/1976 ( 3) -2.20%
    11/18/1976 ( 66) 6.60%
    4/2/1980 (175) 39.00%
    12/17/1980 ( 22) 2.40%
    1/4/1984 ( 15) -1.30%
    3/16/1984 ( 14) -3.00%
    5/1/1984 ( 15) -3.80%
    6/4/1984 ( 23) -0.90%
    8/1/1984 ( 38) 7.10%
    10/18/1984 ( 20) -1.50%
    12/18/1984 ( 66) 13.50%
    5/31/1988 ( 40) 3.50%
    11/30/1988 ( 77) 7.80%
    4/14/1992 ( 8) -4.70%
    7/9/1992 ( 32) -1.70%
    9/10/1992 (109) 14.50%
    1/19/1996 ( 29) 6.60%
    4/16/1996 ( 44) 5.20%
    8/1/1996 (145) 19.50%
    2/3/2000 ( 39) 5.90%
    4/25/2000 ( 10) -3.40%
    5/16/2000 ( 4) -9.50%
    5/30/2000 ( 42) 5.90%
    8/17/2000 ( 18) -1.20%
    9/28/2000 ( 2) -5.50%
    10/26/2000 ( 10) -2.20%
    12/5/2000 ( 8) -8.20%
    12/27/2000 ( 3) -9.70%
    3/29/2004 ( 22) -1.70%
    5/25/2004 ( 31) -1.40%
    8/18/2004 ( 97) 14.20%
    1/31/2008 ( 25) -7.40%
    4/1/2008 ( 59) 0.20%
    7/29/2008 ( 27) -2.70%
    9/25/2008 ( 2) -9.30%
    10/16/2008 ( 4) -5.90%
    11/4/2008 ( 2) -9.60%
    12/2/2008 ( 29) 2.70%
    Mike Scott
    Cloverdale, CA

  7. #7
    Ok - I note if one went back one week in time, you'd find an additional three instances of market rally signals being generated:

    5/25/04 - (1.40%)
    5/30/00 - 5.90%
    5/31/88 - 3.10%
    6/17/76 - (0.10%)
    6/4/84 - (0.90%)

    To me, a bit inconclusive.

  8. #8
    Join Date
    Dec 1969
    Location
    Tarzana, CA
    Posts
    962
    Quote Originally Posted by adam ali View Post
    Ok - I note if one went back one week in time, you'd find an additional three instances of market rally signals being generated:

    5/25/04 - (1.40%)
    5/30/00 - 5.90%
    5/31/88 - 3.10%
    6/17/76 - (0.10%)
    6/4/84 - (0.90%)

    To me, a bit inconclusive.
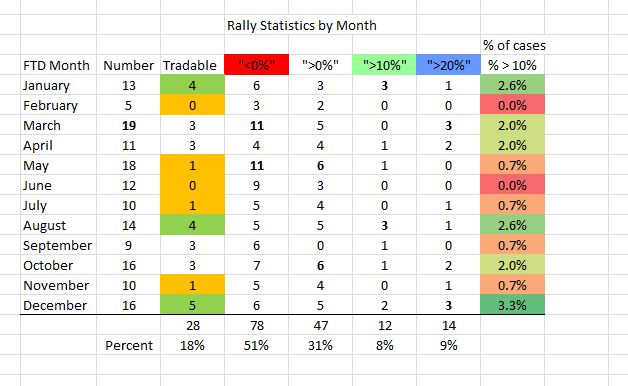
    Here are all rallies including election years. The only May or June rally that added up to anything was May 4 1993 that went up 11.7%. I am sure if I could go back more than 40 years I could find some other examples. One day I will be in position go go back 100 years on the Dow.

    Name:  Rally Statistics.JPG
Views: 333
Size:  56.0 KB
    Mike Scott
    Cloverdale, CA

+ Reply to Thread

Posting Permissions

  • You may not post new threads
  • You may not post replies
  • You may not post attachments
  • You may not edit your posts