-
Envelope?
Hello Pascal,
I am trying to better understand the envelope calculated by the breakout calculator. You state "We can see below that the 2.4% envelope captures 90% of all the price bars for the analysis period." This essentially means only 1 of every 10 bars (on average) should break the envelope. From the naked eye, it certainly looks like more than 1/10 bars break the envelope if you count the # of break vs. # bars. I annotated visible breaks below.
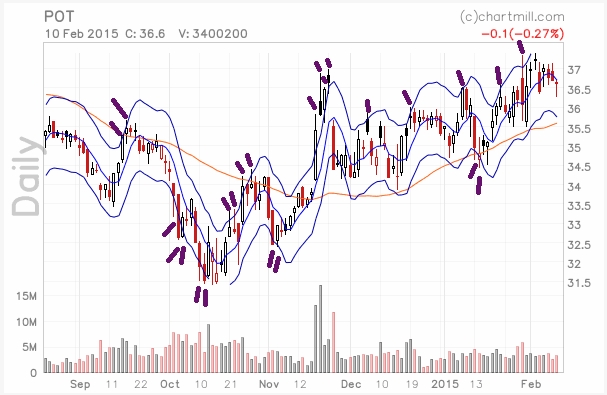
Is this simply due to the envelope was created using a longer data set than the figure shows? From the naked eye, the envelope looks too tight to capture 90% of the moves. Maybe the envelope is calculated using closes vs. high/low? Any insight is greatly appreciated.
Harry
 Posting Permissions
- You may not post new threads
- You may not post replies
- You may not post attachments
- You may not edit your posts
Forum Rules


 Reply With Quote