-
ZS
It has been a long time since I posted a trading idea here.
I'll try to get some ideas out more often as I see them interesting enough.
ZS is an interesting case to study. It is a Cloud based software company that offers access security.
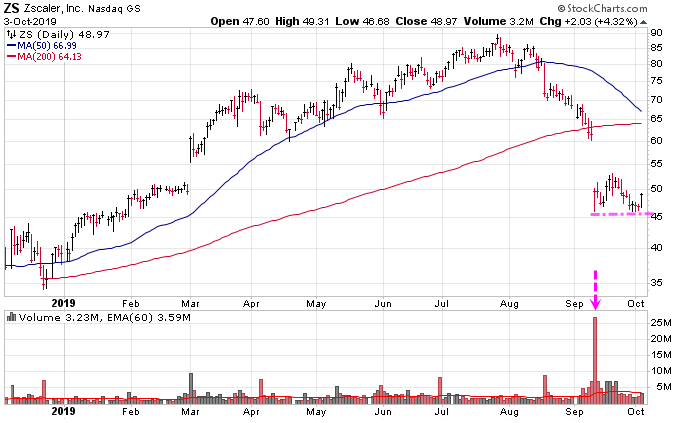
ZS has been the darling of IPO investors until it fell and then crashed a few weeks ago when the CEO stated at the last earnings conference that sales would be weaker than expected in the coming quarter.

The question is only when to buy or also when to short.
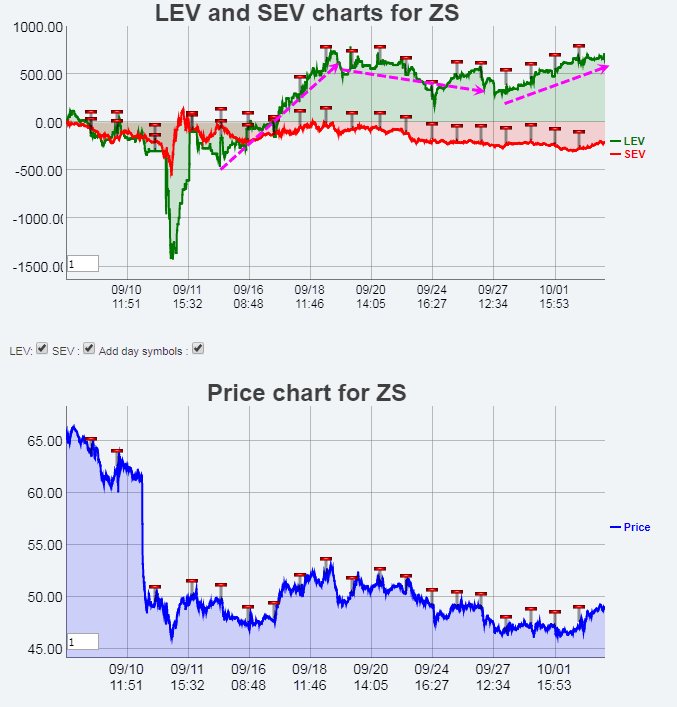
We can see below that the drop attracted investors, but these investors came in because of a to be announced commercial partnership deal between ZS and another company. The CEO waited for the drop to occur before announcing that deal - which I guessed had been under discussion for a long time. After the announcement, the stock price climbed somehow and then dropped again.
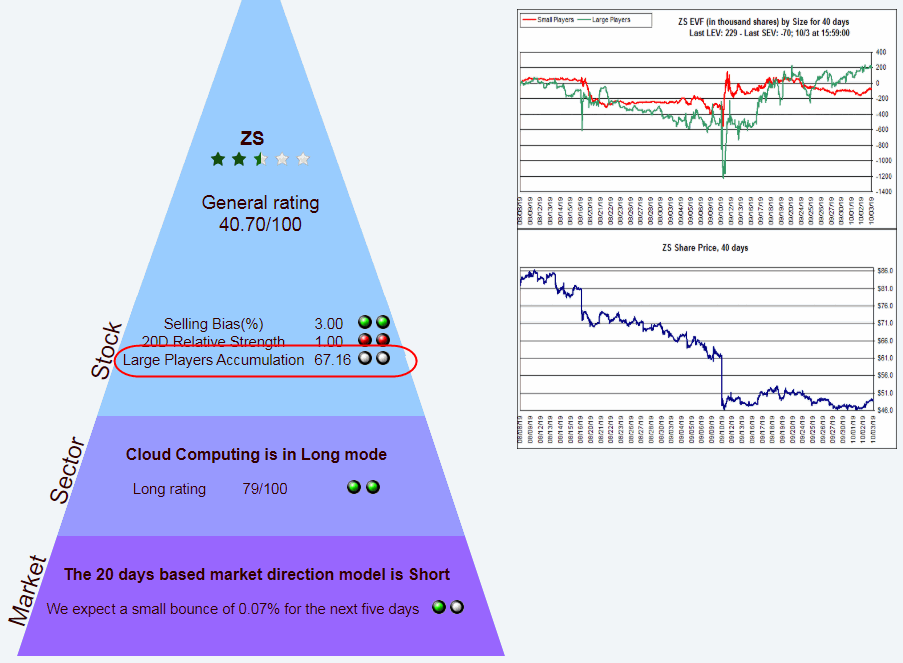
We can see at the right of the EV Figure that there is again some sort of accumulation.

However, that accumulation is not really strong (67 out of a maximum of 100.) This is almost neutral.

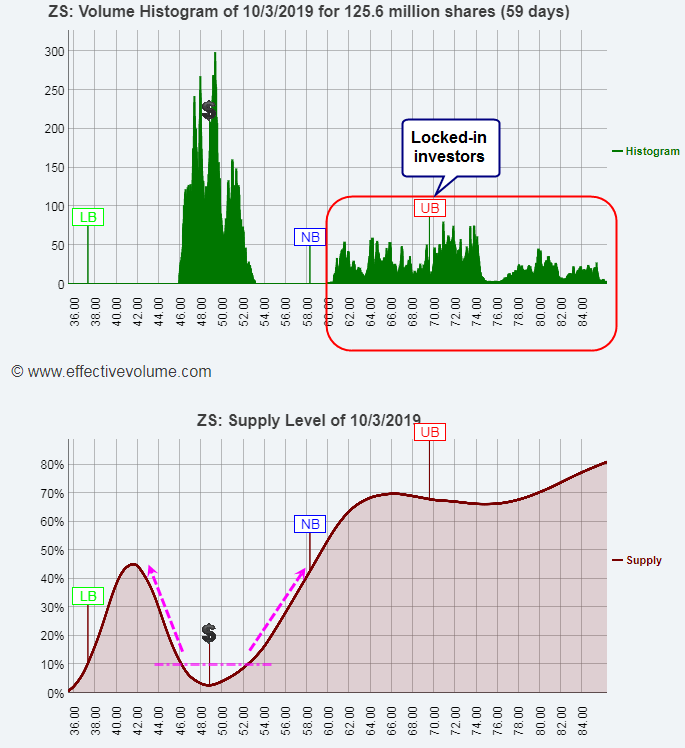
The most interesting Figure is the Supply indicator.
As a reminder, the Supply indicator measures the statistical will of shareholders to offer their shares for sale. This measure is separated into those who want to sell to cut losses and those who want to sell to book a profit. Cut losses selling is much more powerful for prices moves because it occurs all of a sudden and almost automatically.
I have back tested on many stocks that when the Supply level falls below 10%, there is a supply shortage, which means that a strong EV pattern could be enough to push the price higher.

We can see that ZS is in such a position for now.
At the right side, there is a group of locked-in investors who will probably wait for the price to move back up. They form a natural resistance.
This resistance will get stronger from $52, when the Supply will gradually increase.
On the left side of the Supply indicator, we can see that Supply will also increase of we cross below $46. Why is this? Simply because many recent buyers will start selling due to their stops being hit. If we break below $46, it is very probable that the stock will jump down to its Lower Boundary - the low limit of its down trend, which is close to $38.
If you want to buy, the best strategy is to buy close to $46 IF the EV pattern is strong (Accumulation higher than 80 on the Pyramid data.) Of course, you will need to get out if you see that this level breaks down.
The stock can be sold at $52 or higher. Indeed, we can see that the float of ZS traded within 59 days. Since the last drop occurred about one month ago, ZS would need to churn at the current price for another two months to finish eating up the supply that is ahead iof $52.
For the moment, the best is to wait and see what happens. The probability that the stock breaks above $52 is rather low. As we approach the earnings release (in two months,) investors will sell again as the CEO already advised of a coming relatively poor performance.
The stock is tradable between $46 and $52.
 Posting Permissions
- You may not post new threads
- You may not post replies
- You may not post attachments
- You may not edit your posts
Forum Rules


 Reply With Quote