


What correction ?
I am looking for long swing entries again, after my first long attempt was stopped out.

What correction ?
I am looking for long swing entries again, after my first long attempt was stopped out.
This chart looks weaker.
But the price action on NQ, TF and also ES is not so weak yet.
I will look for this downside break out to peter out the next days.
The ES alone has a breakout of consolidation - bearish
But the context does not seem right for a severe breakdown, just a technical one.
To me this is most likely a political market now.
A further new potential theme is a reversal of the fear trade (commented on by some)
I will look for weaker bonds, utilities, reits, staples, gold and stronger US equities.
Last edited by PeterR; 10-12-2016 at 06:19 AM.
a bounce - so far.
161017 EoD
The RTH sessions are still relatively weak.
IMO people waiting for the US election.
Lots of money on the sidelines for now.
nothing to see here - move along !
This chart looks bearish currently.

Thank you Peter.
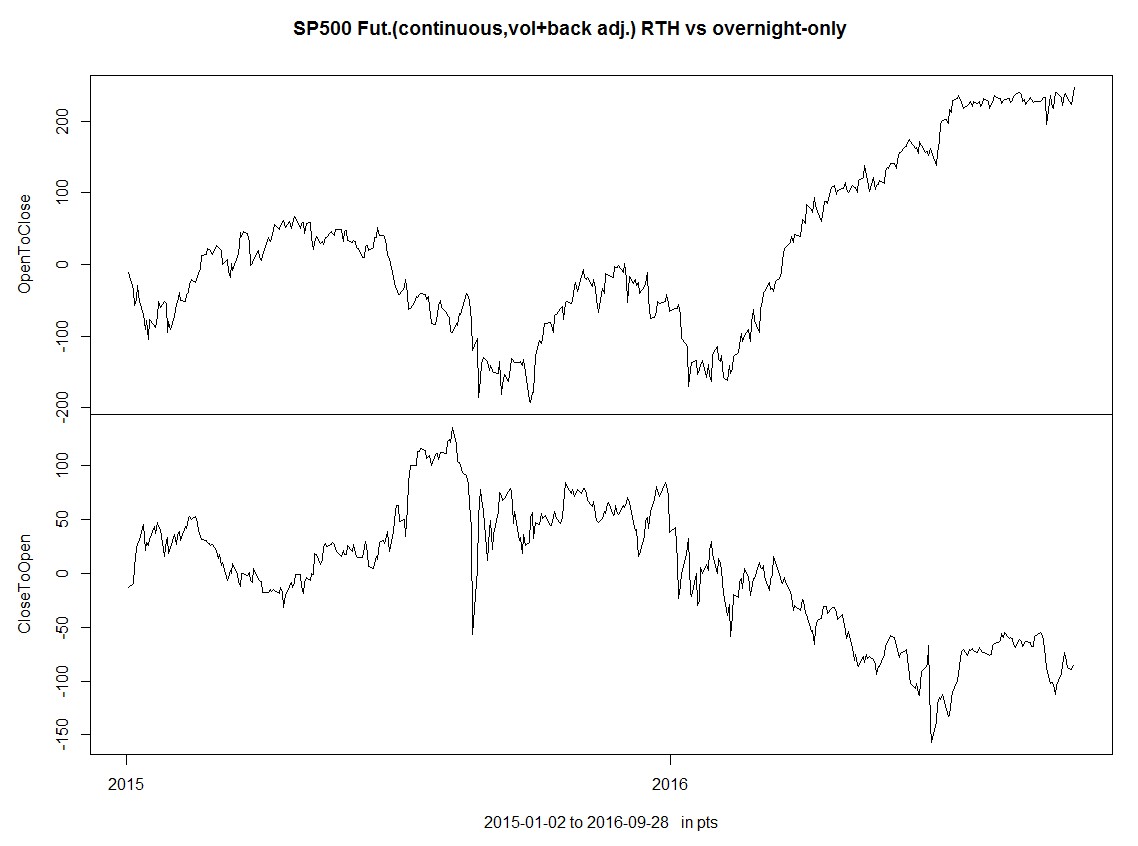
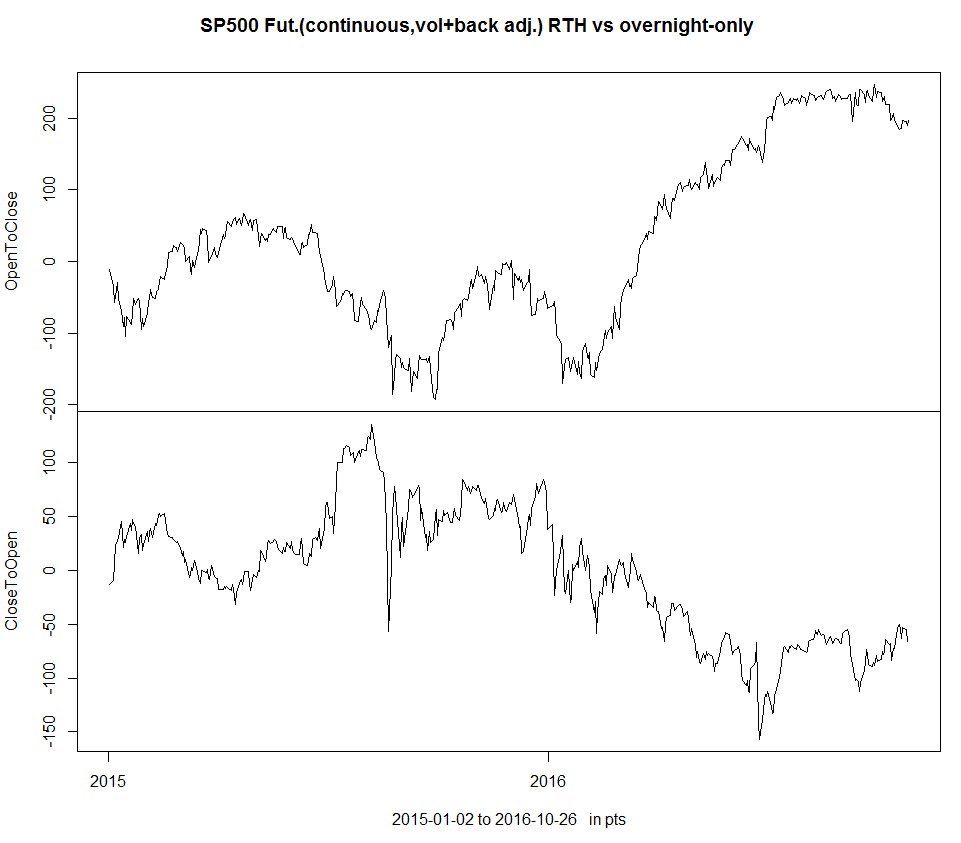
I was wondering whether in the past the negative divergence between RTH and Overnight (drop in RTH while overnight pushing up) have been a buying opportunity or not.
Do you have enough past data (Only after March 2009) to do a small backtest?
Thank you
Pascal
Hi Pascal,
here is a plot that shows the time series together.
(I was unable to get a grid working in the background - so it is a little challenging to read).
I can identify phases of market behavior, that point to some potential flows.
Like you identified BOJ flows at the start of 2016.
And 2014 to mid 2015 overnight outperformed regular hours.
All of these phases seem to be ephemeral and not regularly repeating.
But maybe we can spot something more in the data.
Peter
(the data is Futures data again. potential rollover-gaps are back-adjusted via volume. No big gaps in the e-mini anyway)
still bearish
 Posting Permissions
 Reply With Quote