For me, the story of the current market is ACIA. ACIA has traits of a real leader; the price movement is evident. ACIA is a leader in the optical-interconnect industrial space which is seeing a secular surge in demand. ACIA was on my June watch lists before its move. I had to buy it twice as I got stopped out of the June 16 breakout from its IPO base. I repurchased as it made new highs on 7 July. Now, I have to decide if I want to cash out with 150%+ gains or hold for the longer term. I did a study of some prior big winning stocks, and I am focussing on MSFT, not the MSFT you know today, the MSFT of 1986 which went up 256% in eight months; MSFT was supported by the 10-week moving average all the way up. Along the way, MSFT pulled back from 9% to 14.5% five times. MSFT, at that point, was in the middle of the secular move in personal computer systems. MSFT as such is my yardstick for monitoring the action of ACIA.
The median growth stock pulls back 17% along its upward trajectory that lasts about a year, so a pullback this far could easily happen, but the worrying starts at 15% based on the MSFT precedent. From here, ACIA could form a High-Tight Flag, carve out a standard base or just continue up. A High-Tight flag represents a buying opportunity, the strongest of all patterns. We are probably a couple of weeks before a proper HTF could form. An HTF rises 100% or more in eight weeks or less and then forms a tight (<-20%) pullback over two to five weeks. The buy point is as the stock moves to a new all-time high. ACIA is showing a tendency not to wait around to form a proper base so that it could do anything from here.
Usually, when I see a stock create its first first-stage base, I compute a future price target based on the history of prior leading growth stocks. History shows that leading stocks can expand their PE ratio 130% from the PE ratio existing at the breakout. My price target is $210. However, it still hasn't formed its first stage base; I used the IPO base for the calculation
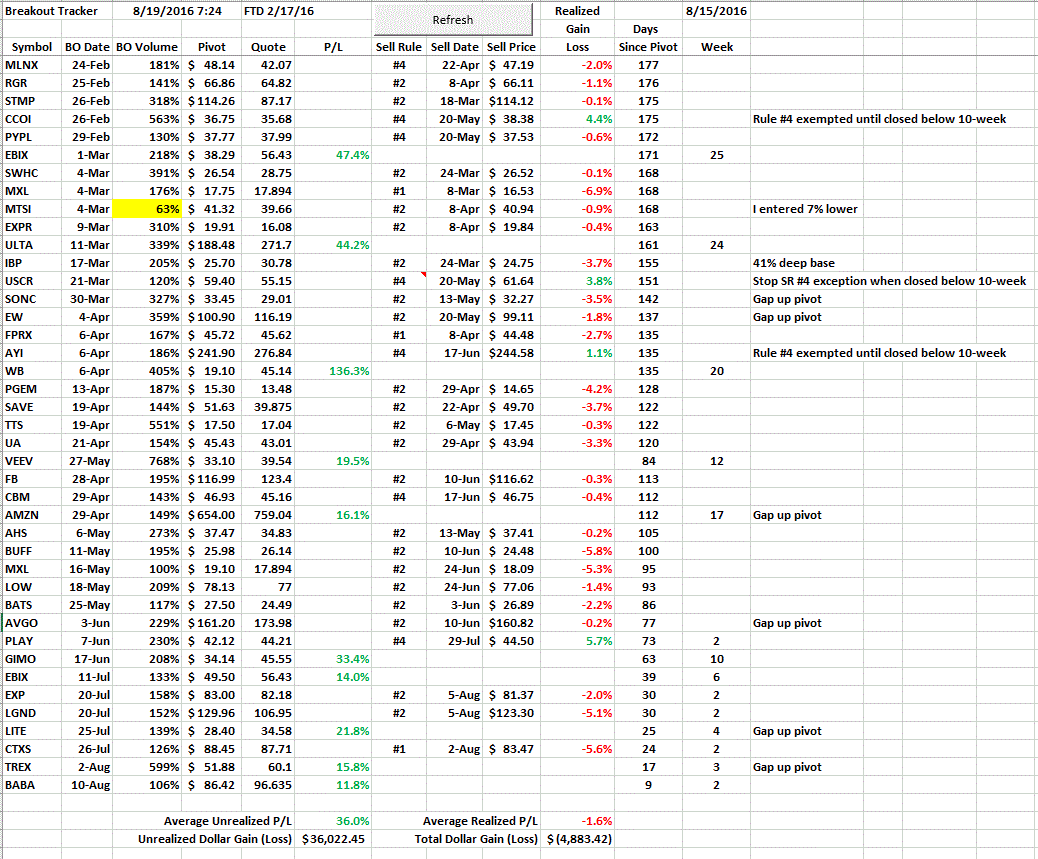
The image below is an update of the system buying growth stocks that exhibit breakout strength of volume at least 100% above average and using just six sell rules. You can see that the system is holding ten positions. The modeled purchase amount was $10K per purchase with an overall gain now of about $32K. The ten positions are up from 12% to 136%; the longest held position is 25 weeks. There are many more losses however the losses are small.
Attachment 37493


 Reply With Quote

