+ Reply to Thread
Page 2 of 3 FirstFirst 1 2 3 LastLast
Results 11 to 20 of 27

Thread: Coding the Active Boundaries indicator

  1. #11
    Looks good indeed.
    I filter with a 3MA. Looks better that way.


    Pascal

  2. #12
    Join Date
    Mar 2013
    Location
    Reggio Emilia, Italy
    Posts
    24
    Quote Originally Posted by Pascal View Post
    Looks good indeed.
    I filter with a 3MA. Looks better that way.


    Pascal
    Thanks, I will try to filter with a 3 period MA.

    As a test, I have also added the Bollinger Bands: below are some entry signals based on the BB (50, 2.5).

    Name:  ZA820.png
Views: 3130
Size:  53.6 KB

  3. #13
    Join Date
    Dec 2013
    Location
    Poland
    Posts
    11

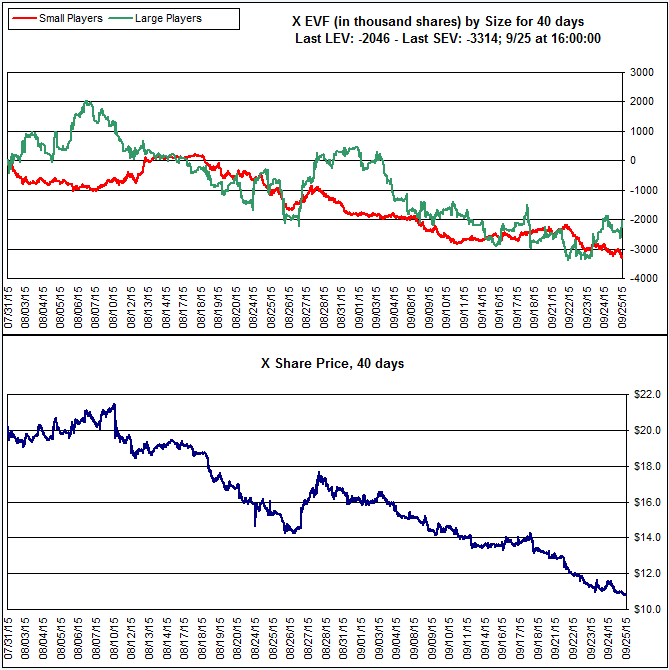
    Effective Volume indicator

    Hi Pascal,

    i'm also working on the indicators from your excelent book 'Value In Time'. Would be possible to get a picture of Effective Volume of minute data for the company X for the comparison purpose. I would be very greatfull.

    Thanks

    Jarek

    Quote Originally Posted by Pascal View Post
    I think that what you are asking is technically too difficult for non-developers to come up with an easy response.
    The AB calculation is similar to a VWAP calculation. A VWAP uses the Volume to calculate the average price. (Volume weighted Average price.) AB also needs to use the number of shares that were exchanges at each price level: this is also a volume weighted average price and not a simple average price.

    Below is the minute data for the company X and the Active Boundaries graph as of last night.
    The best is that you try your different ideas and see which comes close to the pattern below.
    The, the answer will be obvious.


    Pascal

    Attachment 25307

  4. #14
    Here it is


    Pascal

    Name:  X_EV.gif
Views: 6020
Size:  22.0 KB

  5. #15
    Join Date
    Dec 2013
    Location
    Poland
    Posts
    11
    Thanks a lot!

    Even though I was able to download only last 15 days from Yahoo finance it looks good.
    I'm trying to test your indicators on Polish market and have no full access to minute bars of the US stocks.
    I would be double glad :) if you would attach the last 40days data of X to be sure :)

    Regards

    Jarek

    Quote Originally Posted by Pascal View Post
    Here it is


    Pascal

    Attachment 32373

  6. #16
    Quote Originally Posted by jagin View Post
    Thanks a lot!

    Even though I was able to download only last 15 days from Yahoo finance it looks good.
    I'm trying to test your indicators on Polish market and have no full access to minute bars of the US stocks.
    I would be double glad :) if you would attach the last 40days data of X to be sure :)

    Regards

    Jarek
    here is the "X" data

    Pascal

    X_TMP.xls

  7. #17
    Join Date
    Dec 2013
    Location
    Poland
    Posts
    11
    Quote Originally Posted by Pascal View Post
    here is the "X" data

    Pascal

    Attachment 32396
    Double thanks Pascal :)
    My indicator looks good all the way.

    Regards

    Jarek

  8. #18
    Thank you, Mr. Pascal Willain for explanation. Here is what I got (I made calculation of Active Boundaries using Python, and imported the result into Amibroker).
    Attached Images  

  9. #19
    Quote Originally Posted by rupiter View Post
    Thank you, Mr. Pascal Willain for explanation. Here is what I got (I made calculation of Active Boundaries using Python, and imported the result into Amibroker).
    Congratulations!

    I hope that this will help your trading. Active Boundaries are a valuation tool. This tool works well if used in a wider range of tools that can measure the trading ecosystem. This is at least what I try to do.


    Pascal

  10. #20
    Quote Originally Posted by Pascal View Post
    Congratulations!

    I hope that this will help your trading. Active Boundaries are a valuation tool. This tool works well if used in a wider range of tools that can measure the trading ecosystem. This is at least what I try to do.

    Pascal
    Thank you! That’s what I’m trying to do now. My current task is figuring out Effective Volume formula.
    The data file you provided in the post # 16 was of a great help. Actually I had little problem with EV itself but have some difficulties with understanding how Separation Volume was chosen. Can you help me clear the situation?

    I did everything according to textbook.

    For example, let’s have a look at one-day period on 06.08.2015. Total EV for that day was 5925757 shares. There were 353 trading minutes where EV was detected. Thus Separation Volume according to Average Separation Method would be 5925757 / 353 = 16787 shares. (I calculated it just for comparison).

    To determine Separation Volume with Equi-Power Separation Method, I first arranged EV data in descending order and started to count running total until it was close to half of EV amount of that day (5925757 / 2 = 2962879 shares). On value of 24939 the running total was 2962810 which was pretty close to the goal. So I would say that Separation Volume should be some value between 24939 and next lower value in a row (which is 24631.38605). I chose 24938 as Separation Volume value.

    Name:  2016-02-18_11-45-26.png
Views: 3099
Size:  11.3 KB

    Then I compared my SVS / LVS with those values in the data file. As you can see on the picture at 10:01:00 EV was lower than my Separation Volume value so this EV should have been added to your SVS running total. But as it’s shown on the screenshot, that value was added to your LVS (to be precise, it was subtracted, because it was negative value).

    Name:  2016-02-18_12-12-35.png
Views: 3064
Size:  18.2 KB

    Tweaking the values, I found out that Separate Volume that was chosen by you, was something between 23546 and 23120.625. But it means that the pool of shares of the Large Effective Volume is bigger than the one of Small Effective Volume… Analyzing other minutes I saw similar situation – chosen Separation Volume value divided all shares unequally.

    Why is that? Or maybe I missed something and my calculations are somewhere wrong? Thank you.

+ Reply to Thread

Posting Permissions

  • You may not post new threads
  • You may not post replies
  • You may not post attachments
  • You may not edit your posts