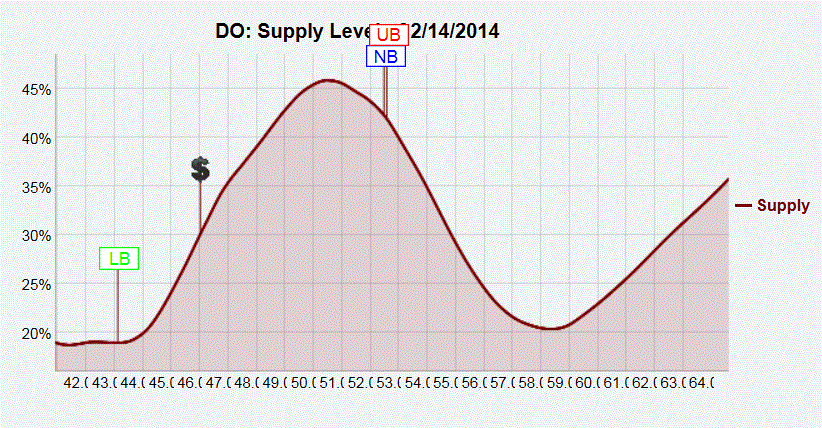
Daimond Offshore
Pascal,
I am interested in your comments when the RT supply looks like the chart below. The background to my question is that the offshore drilling sector has gone through a significant sell off probably because of the Gulf oil spill accident. Now the US has restarted oil exploration license auctions for the Gulf and the major players are lining up to participate in a big way. So I am expecting a bottom eventually for the industry, particularly in the "picks and shovels" versus the oil explorers part of offshore drilling sector. I see nothing technically indicating the bottom is in with Diamond Offshore and this is the first time I have looked at a supply chart where the current price is over the hump on the left side and the upper boundary and neutral boundary are high up in the supply curve. The current supply chart looks quite unstable to me. How would you expect the supply chart to transition if DO actually bottoms and rallies?

Mike Scott
Cloverdale, CA


 Reply With Quote
