LPPL
Didier Sornette has updated his web site relating to Log Periodic Power Law market bubble warnings which he described in his book Why Markets Crash.
http://risikopedia.ethz.ch:2375/#
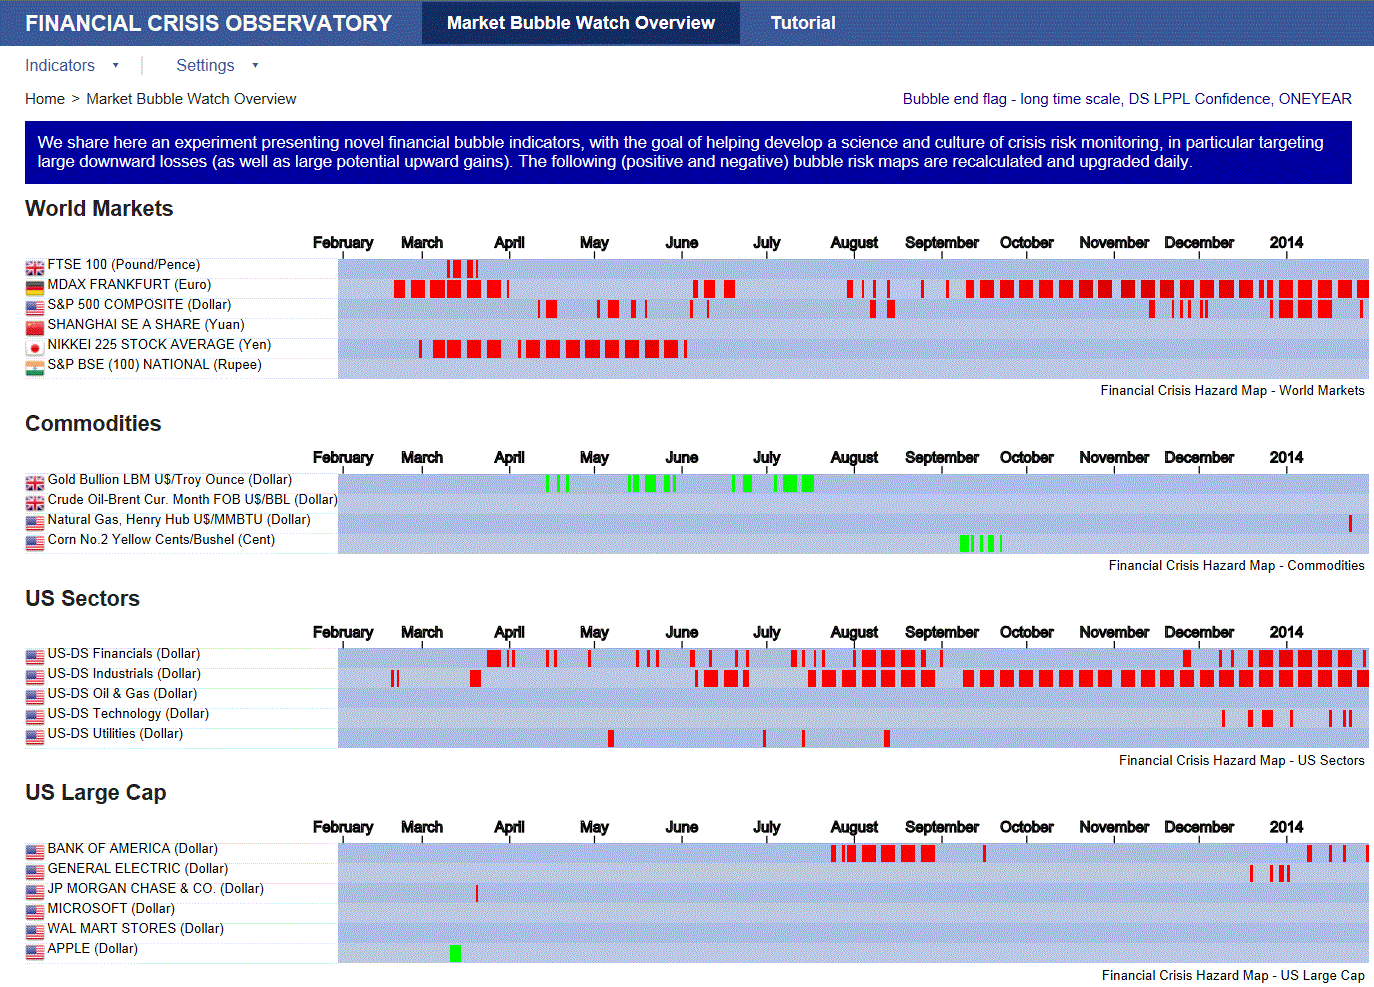
The data shown are confidence levels that a bubble has formed that can lead to a downward thrust in the market. It shows many worldwide indices and a few widely traded stocks. By clicking on one of the red or green warnings a time history of the confidence level. The site looks like this:

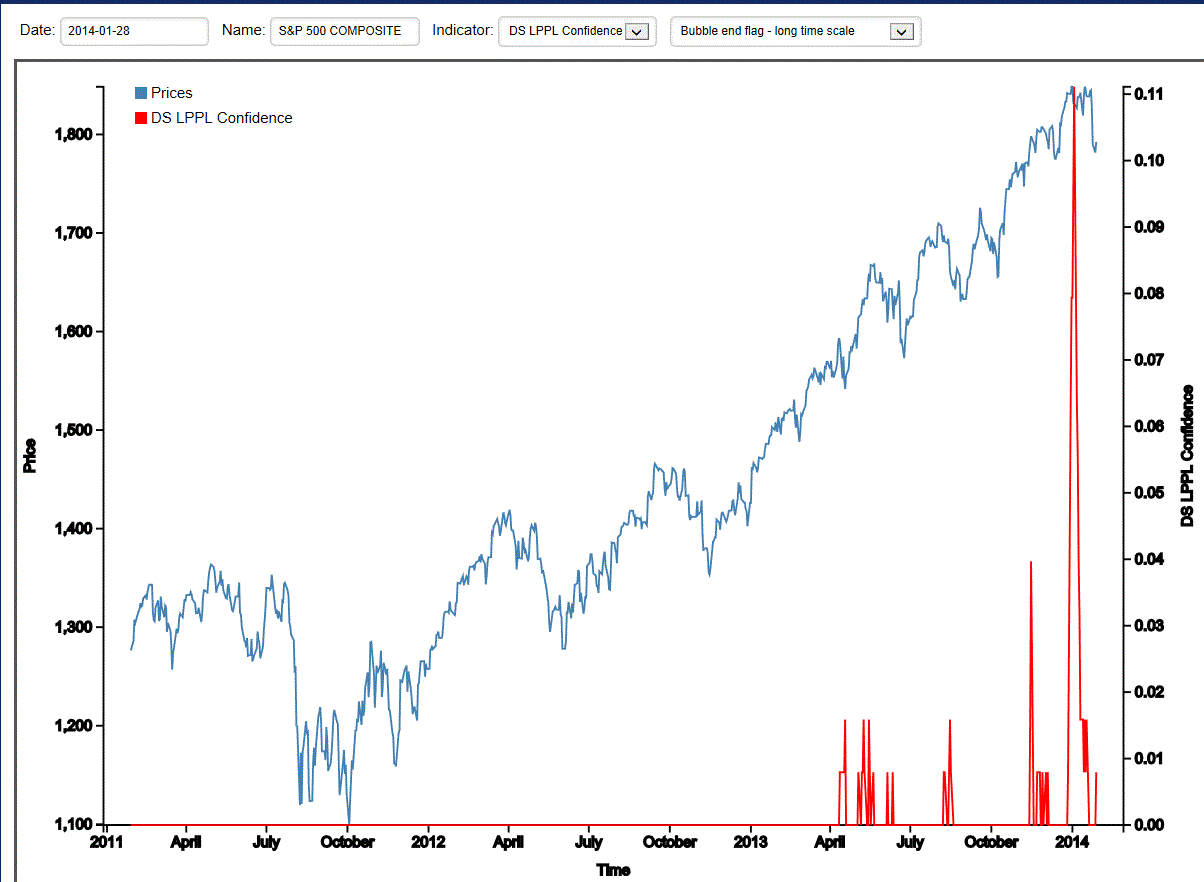
The S&P500 confidence looks like this:

Note that the S&P may have put in a double top and that the warning came on the first top. I find this means of presenting the data is easier to use than fitting a log periodic curve to market data. When I am done fitting I never quite know if the fit was good enough. I don't yet know for example how good a confidence of 0.11 is but with some experience down the road we may find out.
Mike Scott
Cloverdale, CA


 Reply With Quote