Joelo,
The Supply figure shows how eager shareholders are to sell their stock depending on the price.
Whenever the supply is lower than 10%, it means that few shareholders are ready to sell. The lower the supply Figure, the better.
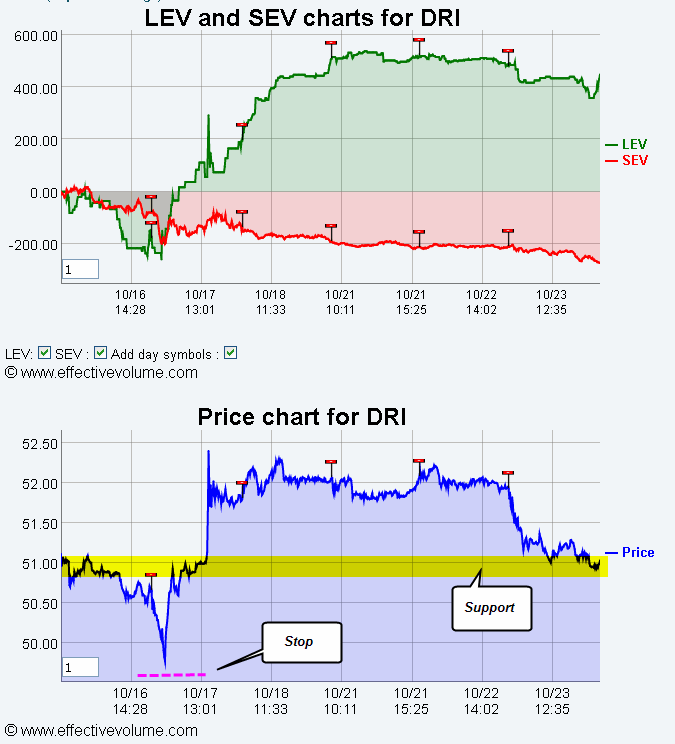
This Supply level must be combined to the EV pattern. If you see a strong stock that is pulling back in price back down to the <10% supply level with EV showing that large players are not selling, then there is a good probability that the price will bounce.
You can see below that CIEN and DRI are showing this type of patterns.
Pascal


 Reply With Quote