-
06/16/2013 Mousetrap
Sector Model XLB -0.72%
Large Portfolio Date Return Days
CAJ 9/25/2012 -5.00% 263
BOKF 2/4/2013 13.03% 131
SWM 2/12/2013 40.58% 123
MWW 4/11/2013 19.87% 65
ABX 4/11/2013 -19.42% 65
TPX 4/22/2013 -4.26% 54
TTM 5/6/2013 -4.77% 40
DLB 5/13/2013 -1.63% 33
GMCR 5/24/2013 7.47% 22
MATW 6/6/2013 0.29% 9
S&P Annualized 9.75%
Sector Model Annualized 24.11%
Large Portfolio Annualized 30.81%
From: http://market-mousetrap.blogspot.com...blindside.html
Rotation: selling MWW; buying OKE.
http://www.youtube.com/watch?v=bioyh7Gnskg
This will be the fifth time trading OKE, and it’s a bit of a wild card. Of the first four trades, two were profits and two were losses.
The market itself is a bit of a wild card, to be honest. A look at the market news stories these last few weeks has been a tug of war between euphoria and despair. Hussman is calling a market top for the bazillionth time, while Dr. Doom Roubini is bullish.
This is not a normal market. Never before has technology been coupled with artificial intelligence. Robots are not just machines, but something else entirely. And we are not only competing with them for our jobs, but in our investment decisions as well. Think technology squared. Added to that we have a dysfunctional political environment and a central bank trying experiments never ventured in this country’s history.
Blissfully unaware of all these massive exceptions from the rule, the market moves, as always, in its natural logistical curves:
http://en.wikipedia.org/wiki/Logistic_function
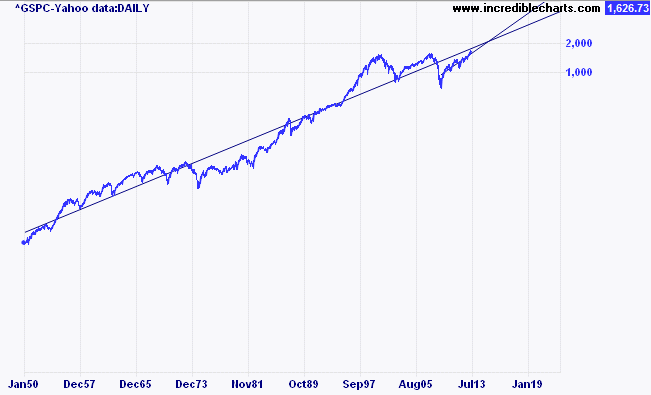
The basic idea is that the market is always after some kind of moving target, and each day, week, month, year, it randomly moves up or down based on two percentage factors: 1) its current position and 2) the position of that moving target. It may not HIT that target, but it always has one in mind. For instance (using a simpler method to approximate the idea), the current target is likely in the 2050 range on the S&P, around the beginning of 2015:

On this chart I plotted a linear regression for the entire 1950-present period, and another from the March 2009 low-present, and extended both lines forward. They cross around 2050 by the end of January 2015.
That’s where the market THINKS it is going.
And the market THINKS it would be natural and normal to get there – regardless of how unnatural and abnormal the true economy is.
Keep in mind that no technical trick can plot an exact date or price of where the market WILL be – only where the market THINKS it will be.
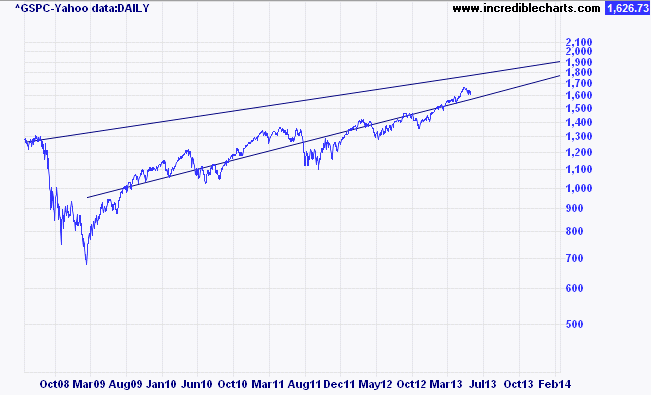
Now look at that chart a bit closer:

Notice that the further apart the two regression lines are, the greater the size of the cycles. As the two linear regressions fall closer together, the size of the market swings subsides.
But here’s the caveat: if the market truly belonged where it THINKS it belongs, we’d ultimately subside into zero volatility in a single straight line.
And we all know that will never happen.
There is a long term standard deviation of the market, and the less it deviates in the short term, the more it will deviate in the future to make up for it. What’s happening is that as investors get more and more fixated on where the market THINKS it is going, the more they ignore other reasons for it to be a different value altogether. This is a natural filter we have that is well documented:
http://www.scientificamerican.com/ar...ot-let-you-see
In investment terms, the more convinced you are, the less likely you are to be right.
What the market lacks – what most investors lack – is Risk Intelligence.
There’s a good test to measure your “Risk Intelligence” here:
http://www.projectionpoint.com/
Incidentally, this cockiness caveat is the reason women tend to do better than men in the market. All that testosterone gives you just enough confidence to hang yourself.
Happy Father’s Day, all you horrid investors!
I have more to write, but it will have to wait. For the next few weeks I’ll be editing my book into a kindle format, in addition to the existing hardback and Accordance module formats:
http://www.cornerstonepublications.org/prod01.htm
We’re currently updating the text to the newest (28th) edition of the Nestle Aland, just released. For those who have the hardback copy, we’ll provide a short PDF insert of the minor changes to the text (about two pages). The kindle and Accordance packages will be fully updated to the handful of changes in the Catholic Epistles.
Until then – don’t get too cocky out there. Your own certainty is your worst liability.
Relax. Sit back. Read a book. Read mine! That should keep you occupied for a spell
Tim
-
I'm glad to hear that my lack of testosterone is giving me an edge in the market. I desperately need one! :-)
Very interesting article. I'm learning a lot here. Thanks for posting.
-
Thanks
Obviously I got some pushback from the guys on that one...
 Posting Permissions
- You may not post new threads
- You may not post replies
- You may not post attachments
- You may not edit your posts
Forum Rules


 Reply With Quote