5-19-2013 Comments
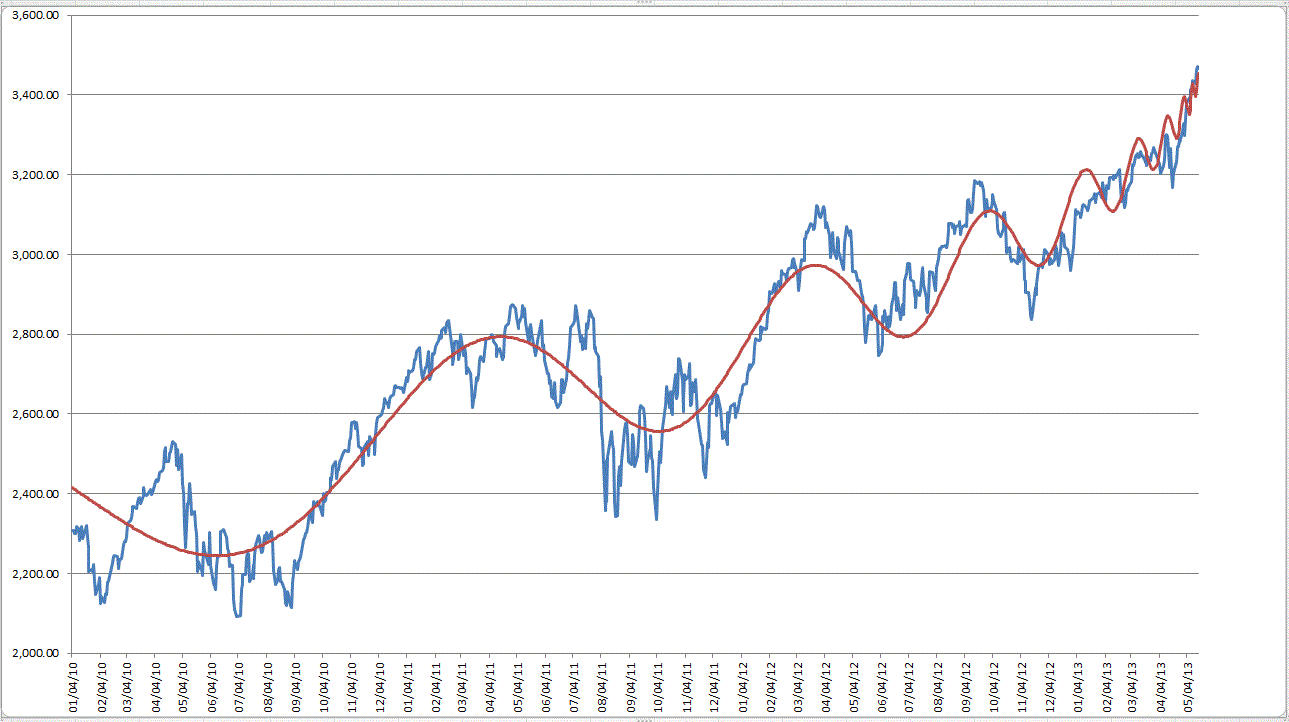
The market so far just wants to run up. I have looked at the vertical nature of the indices which has be wondering about whether the current thrust is getting overheated. Using techniques suggested in Didier Sornette's book Why Markets Crash I offer the following chart of the NASDAQ with a fitted Log-Periodic Power Law curve. The fit may or may not be great but seems to point to a critical juncture on the near horizon, possibly this coming week.

I am new to these techniques so I offer this in the spirit of sharing my current investigations and am not sounding the alarm bell. However if the market falls apart next week I will start paying closer attention to the phenomena.
When I take a trip through the various IBD index components I find a sea of extended stocks. Buying extended stocks is dangerous, owning an extended stock with a healthy profit margin on the other hand is okay. This extended list includes: HTZ, OCN, LL, ARMH, QIHU, GMCR, ILMN, OII, SNTS, LOPE, CREE, FNGN, USNA, LCC, CAB. I keep my eye on extended stocks because they might set up in the future in a proper buying position.
Stocks that are closer to an action point are: AMBA, ALK, PRLB, NSM, RMD, SBGI, POL, URI, CVI, TUMI and AL. I will be updating the thrust section with this list as my current long watch list. Stocks like NSM, RMD, URI, and CVI I am waiting for a pull back to their buy points. The others I am waiting for fresh breakouts.
I currently own LL, LCC, FLT, CELG, V, TUMI
SBGI looks like a potentially faulty High-Tight Flag structure but could work anyway. High-Tight Flags can produce very powerful breakouts that lead to stocks doubling very quickly. Tesla (TSLA) bears watching in the weeks ahead. It has doubled (the flag pole of a High-Tight Flag) and if it sets up a pull back that lasts a few weeks it could set up as a future High-Tight Flag. Proper pull backs (the Flag) should be no more than 20%.
Given my first chart, should weakness return to the market here are my possible short candidates which will also be in the Thrust Monitor section. I am not shorting right now but one way to detect weakness developing is to have a ready list of candidates setting up in possible shorting patterns and seeing that they are working.
ULTA, MNST, HLF, CVLT, ALXN, AAPL, CRUS, CTSH, HMSY, ULTA
Mike Scott
Cloverdale, CA


 Reply With Quote
