-
Thank you!
These updates are really interesting!
Pascal
-
0110 Update
Hi,
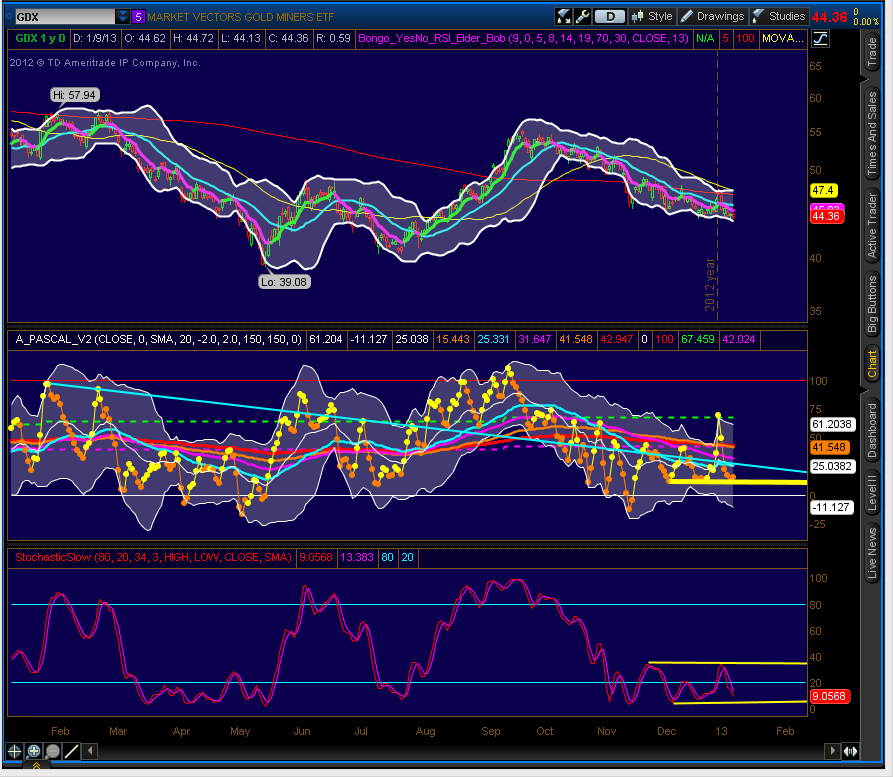
Although GDX price moving averages are still in a bearish configuration, a few things are shaping up, which suggest that we may see a trend change in the next 5-10 days.
1) Percent B is finding a base on the daily chart, with 3 touches at the same level since early December. This type of activity helps to level out and enable pinching of the moving avgs, so support a "spring" type move.
- I looked back a few years and found a few similar basing patterns with 3 touches occurred in July 2010, October 2008 (which struggled with a later 4th touch before decisively turning above the long term avgs).
- There is also a 3 touch pattern that occurred in July-August 08; this led to a slight price increase, but when Percent B stalled at the long term moving avgs, we saw a very steep decline setup.
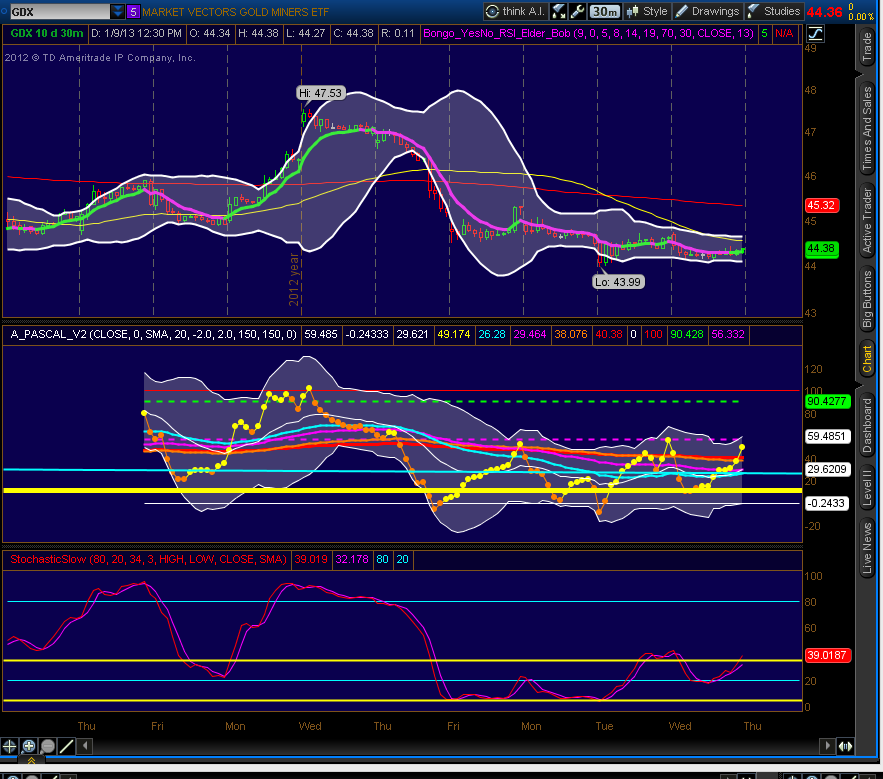
2) Slow Stochastic - a slight divergence is setting up on the daily view, and can clearly be seen on the 30 minute view.
NOTE: Trendlines drawn on the daily show on the 30 min chart - this is how ToS does it. The thin cyan line is the long term trendline - I believe that for a new trend to start, percent B must decisively move above this line and stay above it. As you can see, a cross could occur in the next 1-3 weeks. The heavy yellow bar/line illustrates the 3 touches of percent B shown on the daily view.
DAILY VIEW
We want to see pinching of the percent B moving avgs and a cross of the 8ema over the 20MA on the price chart. Both events are likely to occur in the next few weeks. Price is still in a bearish configuration, but it would not take much to change the direction of the 8ema to setup a cross of the 20sma.
30 MIN VIEW
(Remember that the cyan and yellow lines are from the daily view, so trending above these lines are good developments).
A couple things are apparent. First, in the percent B graph, there is a clear upward divergence with price, which is positive. Second, note that the slow stochastic is clearly starting to trend up as well.
I hope this is helpful. If it could be enhanced let me know. If there are major flaws in the approach, please advise, as I'd like to learn from others who care to share their knowledge in this area.
-
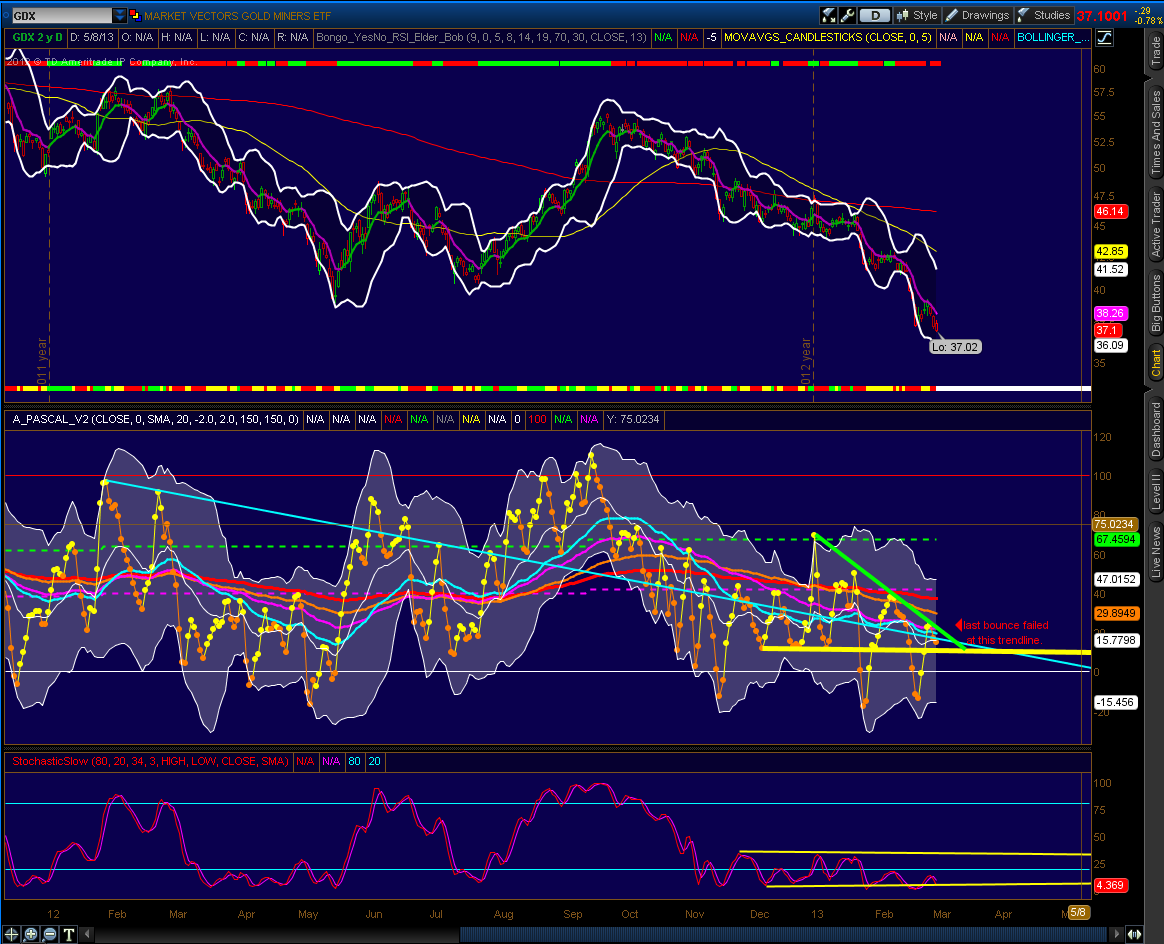
March 01 update
I saw Pascal's message, and since it has been a while since I looked at PercentB for GDX, I thought that I would update this thread. In the chart below:
The Negative:
- Elder 13d Force is still negative
- slow stoch is about as low as you can possibly get, although still not pointed up, so perhaps we'll see it start to turn up soon. It looks like the 20line is good resistance at this point.
- all Pct B moving averages are still pointing down, so it will take some major moves in price to confirm a new trend.
- the LT percentB line is now pretty much almost intersecting the support line that I drew a few months ago.
The positive:
- Although things can stay oversold for an awfully long time, as we've seen, we are due soon for a reversion to the mean type bounce.
- PercentB is perched on the support line (yellow) that I drew a few months ago, and it is about to crossover the long-term trend line (from last Feb). Although things could get more negative, a bounce is due soon.
I guess, as Dave Steckler would say, "we'll know in the fullness of time".
 Posting Permissions
- You may not post new threads
- You may not post replies
- You may not post attachments
- You may not edit your posts
Forum Rules


 Reply With Quote