+ Reply to Thread
Results 1 to 4 of 4

Thread: GDX

  1. #1

    GDX

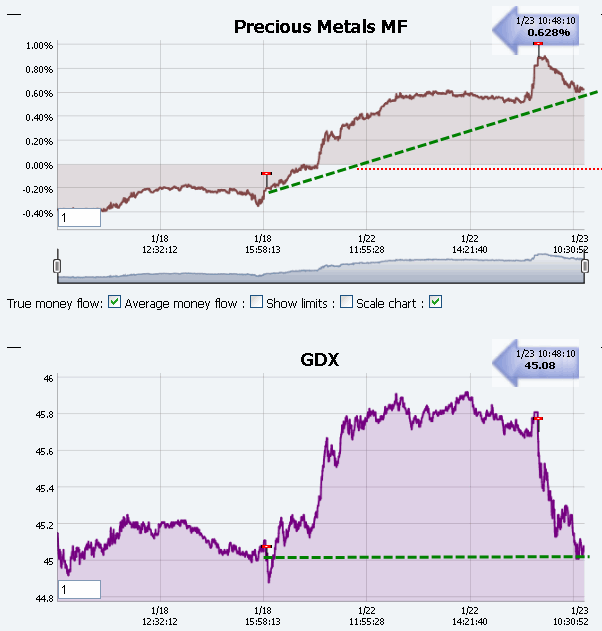
    GDX gave back already what it provided yesterday, leaving us with a general positive divergence in a "strong buy" environment.

    In general, the long-term picture (3 months) shows that we have been in a consolidation mode since last November. There is a good support below us and the stop level gives us much room. There is also strong resistance above with the 50/200MA combination.

    I will be adding to the long position when I see a positive intraday divergence being formed (MF dropping less than the price and showing sellers' temporary exhaustion)


    Pascal
    Name:  GDX_TA.gif
Views: 1109
Size:  23.8 KB

    Name:  GDX_RT.gif
Views: 1121
Size:  29.6 KB

  2. #2

    GDX close to canceling the trade

    The negative MF accelerated late in the day yesterday.
    If we cross below the dotted cash level, we will turn to cash.
    The model will not short because the ATR level is very low.

    As we can see below, in the past, bounces in ATR have been experienced when investors were afraid of a pull-back.
    I do not believe that investors are afraid of a pull-back. However, the sector is not as "hot" as most other sectors and the type of reversal that we had yesterday is not good at all.


    Pascal

    Name:  GDX_RT.gif
Views: 1023
Size:  33.4 KB

    Name:  GDX_ATR.gif
Views: 1001
Size:  23.8 KB

  3. #3
    Join Date
    Dec 1969
    Location
    New Jersey
    Posts
    189

    ATR

    Hi Pascal,

    I have been experimenting with different variations of ATR and wanted to inquire what formula you prefer? Do you utilize the Stockcharts formula:

    http://stockcharts.com/help/doku.php...e_true_range_a

    or another variation for your calculations? I have tried a few but assume you filtered down to the most effective.

    Thank you,
    Harry

  4. #4
    Quote Originally Posted by Harry View Post
    Hi Pascal,

    I have been experimenting with different variations of ATR and wanted to inquire what formula you prefer? Do you utilize the Stockcharts formula:

    http://stockcharts.com/help/doku.php...e_true_range_a

    or another variation for your calculations? I have tried a few but assume you filtered down to the most effective.

    Thank you,
    Harry

    We have been using a 20D ATR, which is the average absolute of the price difference between the Max of (High of day, Previous close) and the Min of (Low of day, Previous close).

    We did not "optimize" but measured different ATR periods and the 20D seemed to be the most adequate, although it is slow.


    Pascal

+ Reply to Thread

Posting Permissions

  • You may not post new threads
  • You may not post replies
  • You may not post attachments
  • You may not edit your posts