1-16-2013 Comments
So far we remain at a +4 exposure count (90% invested). We will get a B5 (living above the 21-day) signal any day that the NASDAQ closes up. I am more exposed than this at 120%. The stocks in my portfolio keep going up sucking me in further. This rally wasn't expected but I don't let my opinions get in the way of making money. I suspect it is the Fed printing press that has us moving up. The Fed may talk about ending QE but who would be left to buy the Treasury debt? I think the Fed may be trapped into QE infinity until we go the way of Greece.
I am reading an interesting book on secular bear markets (Probable Outcomes, Secular Stock Market Insights by Ed Easterling). This book reports on the considerable reasearch conducted by Crestmont Research. Visiting their website exposes much of their data. The book is good. One conclusion that may be a bit depressing is that the current secular bear starting in 2000 may still be in the early stages and nowhere near an exit stage. The Fed may be able to "print" the market up but probably not in terms of purchasing power. The next secular bull market can begin after interest rates go up and then turn south. This could take another decade.
One of O'Neil's portfolio managers reported something interesting this year. He made a major play in the housing sector starting in January of this year. His portfolio went up 300% by correctly timing this sector. These cyclical plays can be very profitable if you know how to time your entry and exits. With the possibility that we may see no net gain in the markets for a long time this cyclical play has my attention.
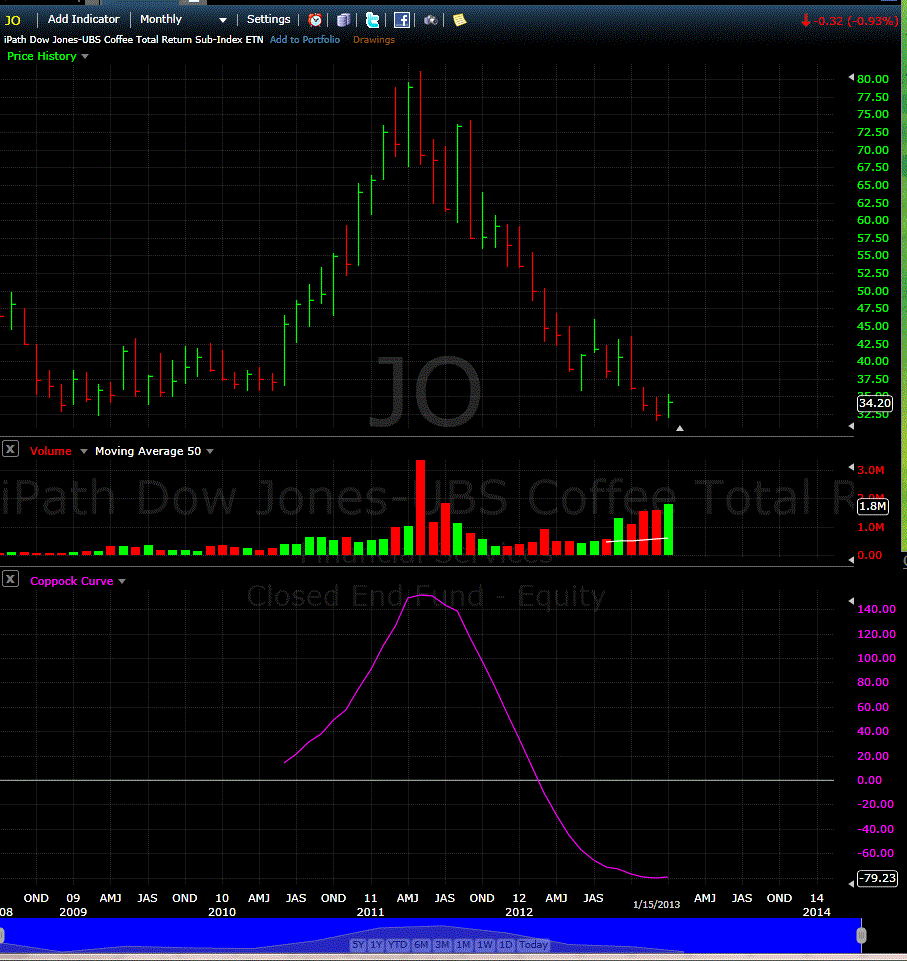
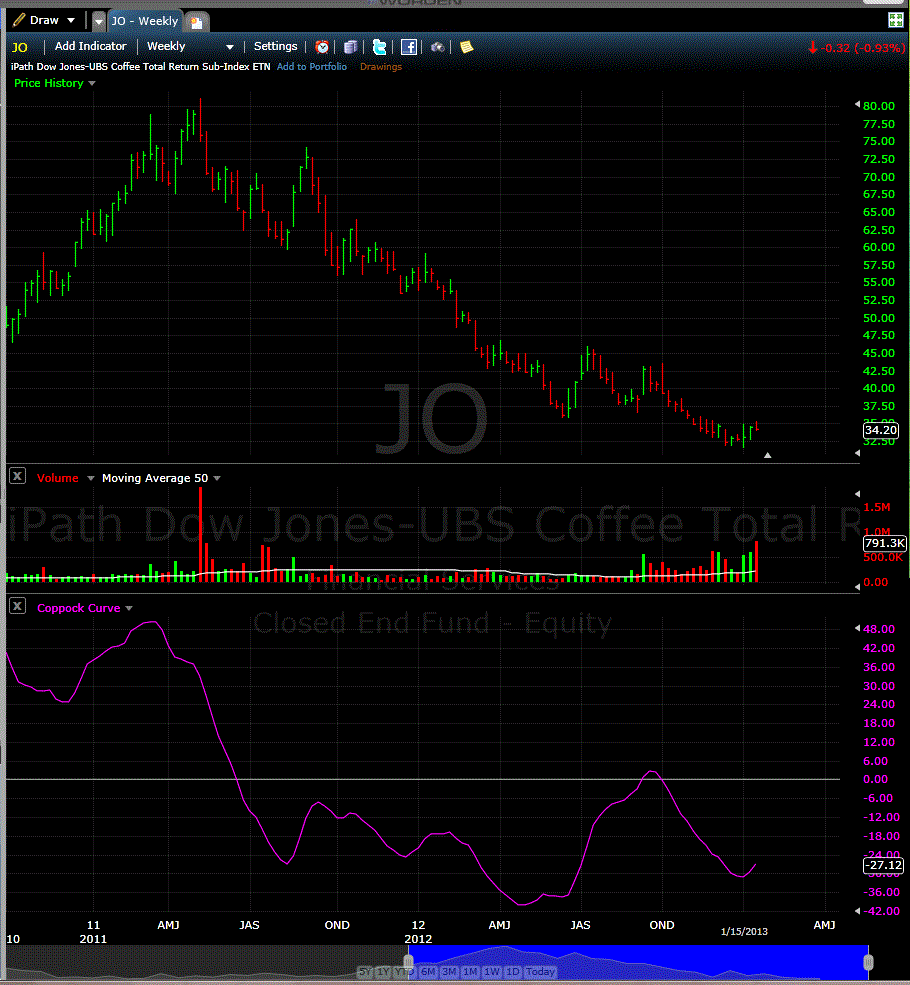
In this regard I have been exploring a method for timing cyclical market entries using the Coppock indicator. You can google the term. We have been using the Coppock for quite some time on the general markets to confirm follow-through days with good success. Relative to a cyclical market take for example Coffee (ETF symbol JO) which looks like it has made a major bottom by inspecting the monthly Coppock. I am not entering a position but I am following this example as a possible model. The housing sector signaled a major buy signal in January of this year and would have allowed us to duplicate the 300% gain example above. This and the fact that the Coppock seems to work with Gold was the impetus to look into this approach.
Anyone wishing to follow along can do so at freestockcharts.com because the Coppock is supported there.
Below are two charts, the monthly and weekly JO charts showing the Coppock indicator on freestockcharts.com. A Coppock buy signal occurs when the value is negative forming a trough and just turning up. Gold (GLD) by the way is just about to signal a new weekly chart Coppock entry point. I may act on this.


Mike Scott
Cloverdale, CA


 Reply With Quote
