5/21/12 Close Comments
Today looked like an oversold bounce with some short covering thrown in.
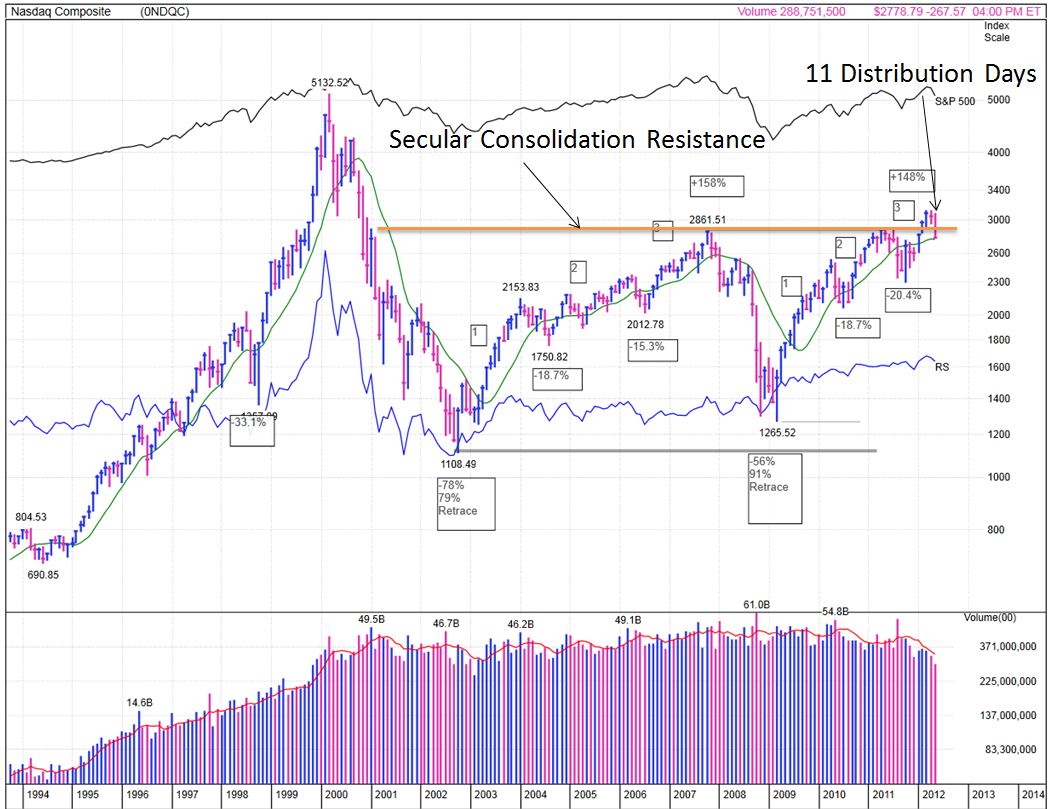
Following the Tuttle Asset Mgt 100-Year Dow theory extended here to the NASDAQ it appears to me that we were living on borrowed time the last month. see chart
We popped up above the secular consolidation resistance line which is typical but usually short lived. Sometimes we penetrate a little higher than this but this looks quite typical of the porosity shown during all past secular consolidations. These consolidations typically last 17 years. To finally break the bounds into a secular bull market (like 1982-2000) the market over the last 112 years has needed to see single digit S&P500 PE (using 10-year average earnings instead of the customary 12 trailing months earnings). We are still around a P/E of 20 on this measure. Professor Robert Shiller of Yale produces these cyclically adjusted PE measurements. (You can google the name with the word "data" and find it easily.)
It appears to me that we have now had a 3+ year cyclical bull market rally of 148% in three waves up. The 2003-2007 rally was similar but longer lived. Both cyclical bull rallies had two corrections exceeding 15%. Those corrections divide the rally in the three waves shown. The current cyclical bull rally is similar in magnitude of gains as the last.
What would complete the picture would be to rally up into a new right shoulder and then a washout. Maybe we began that right shoulder business today. Today would also be day-1 count on a possible new rally. We wait for day-4 or later in order for the shorts to clear and observe real institutional buying intent.
This is an election year and Bernanke is a wild cardů Maybe the washout comes next year after another round of QE this year...

Mike Scott
Cloverdale, CA


 Reply With Quote