-
This time may be different <sic>
An interesting discussion, as I've been watching the VIX and its variants for a few days.
Somewhat striking here is that there is virtually no overhead 2nd resistance cluster within 2*ATR(20) of the closing values -- note the "0" in the R2... column below:
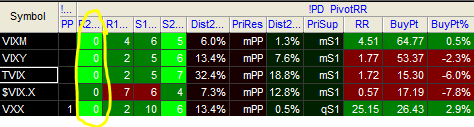
Also note that in terms of pivot points, the monthly pivot (mPP) is the first target for overhead resistance from the present numbers. There is no ambiguity to this fact, which is somewhat unique in my studies of the pivot methods of Billy et al.
Next, note the distance from present values to the first resistance points -- they range from 6.0% (VIXM) all the way to 32.4% (TVIX). This suggests a considerable distance to resistance, which is good if you are long these instruments.
Finally, with respect to the table above, note that the primary support for all of these equities or indexes is the monthly S1 (mS1), or in the case of VXX, the quarterly S1, which dominates the mPP. Note that VXX is NOT the VIX, so the two, while moving in a highly correlated fashion, vary in their correlations from 0.95 to 0.99 depending on whether you are looking at intraday, daily, or weekly values. Don't expect VXX to move lock-step with the VIX.
=============
The question of whether this is a head fake or the real deal at a turning point in this cycle is one I'm trying to get my hands around. Look at the following chart (right-click on the chart to open in a new tab or window):
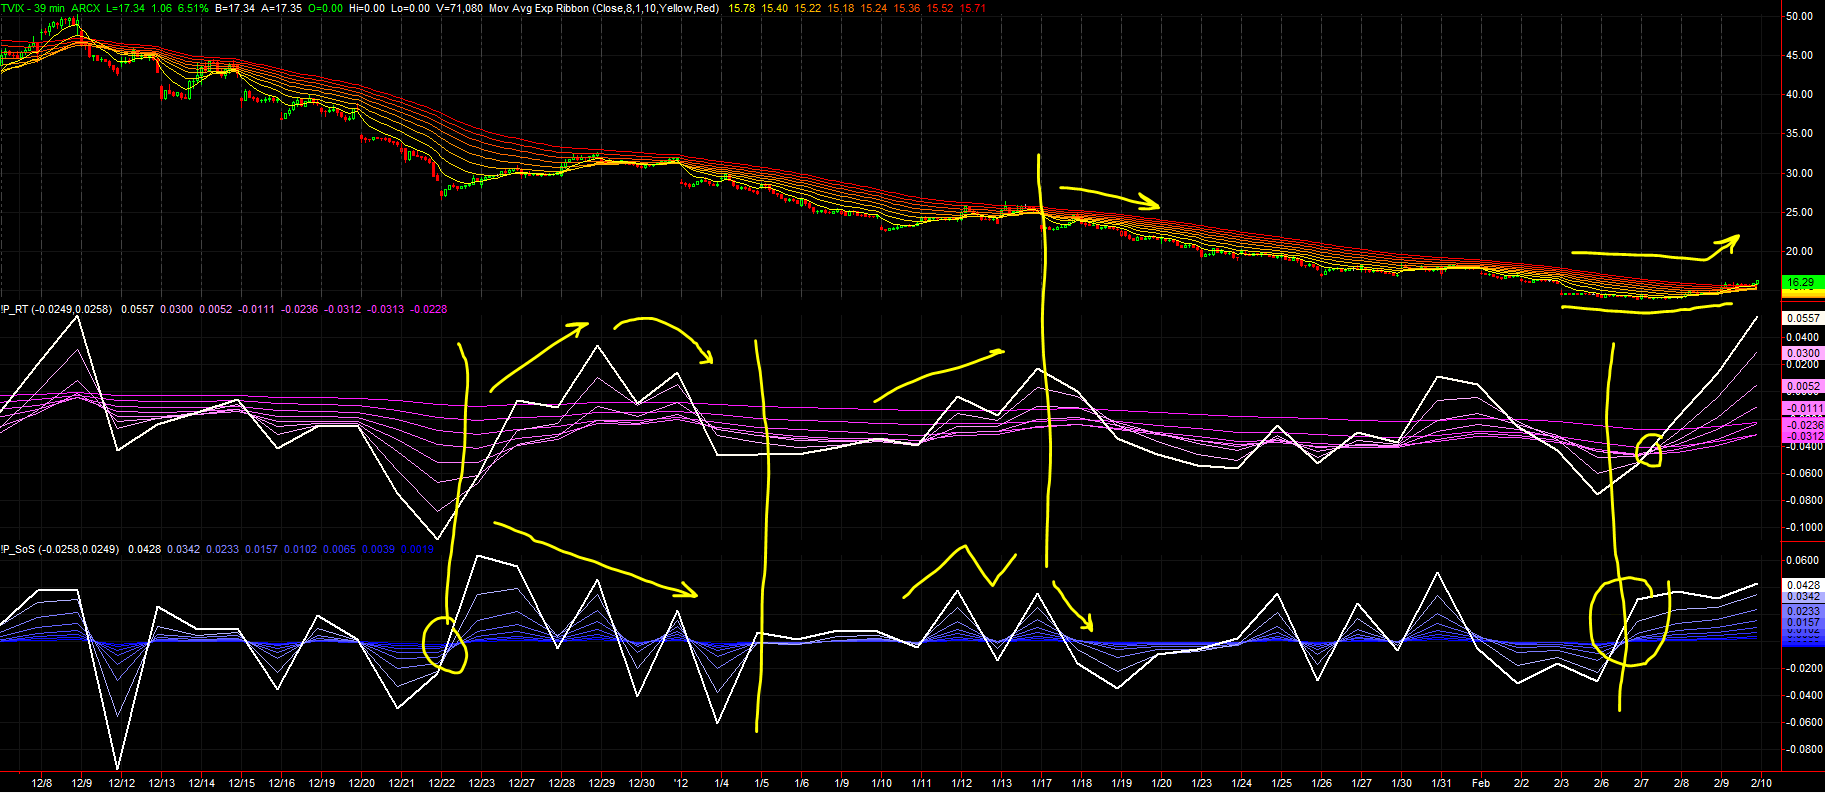
This is chart of the TVIX. The top trace is based on 39-min bars, and you see a ribbon of moving averages that have a downward slope. I picked the time frame of 12/8 to present for a reason -- we had the TVIX moving above the averages around the 12/8 time frame, but several failed attempts at breakouts since then have resulted (as you can see.
The middle trace is my SLOPE of the moving averages that you see above. These are calculated on DAILY closing values, not the 39 min bar values.
The bottom trace is my SLOPE OF THE SLOPE of the moving averages from the top trace. Again, daily closing values.
Start with the bottom trace. THE SLOPE OF THE SLOPE (SoS) LEADS the slope and generally price action either up or down. When the SoS moves above 0, any negative slopes will start to move more positive. We can see that this occurred on this chart around 12/22, which we all know coincided with the GGT system indicating a new long entry was in store. You can see in the cart above that the SoS kept bouncing around for TVIX, making lower highs (bearish for TVIX, bullish for the market), and by 12/29 the slopes failed to rally, hence TVIX continued lower (markets continued higher).
The period around 1/11 saw the same action. SoS started to move higher, but by 1/17 SoS moved negative, and the TVIX slopes failed again, which was bullish for the markets but bearish for TVIX.
"This time it's different". I hate to write that, but it's a distinct possibility. Starting around 2/6 the SoS moved positive, and this caused the downward TVIX slopes to reverse, also now resulting in the shorter ones being positive. This is BULLISH FOR TVIX, and bearish for the markets.
Let's zoom in on the latest action:
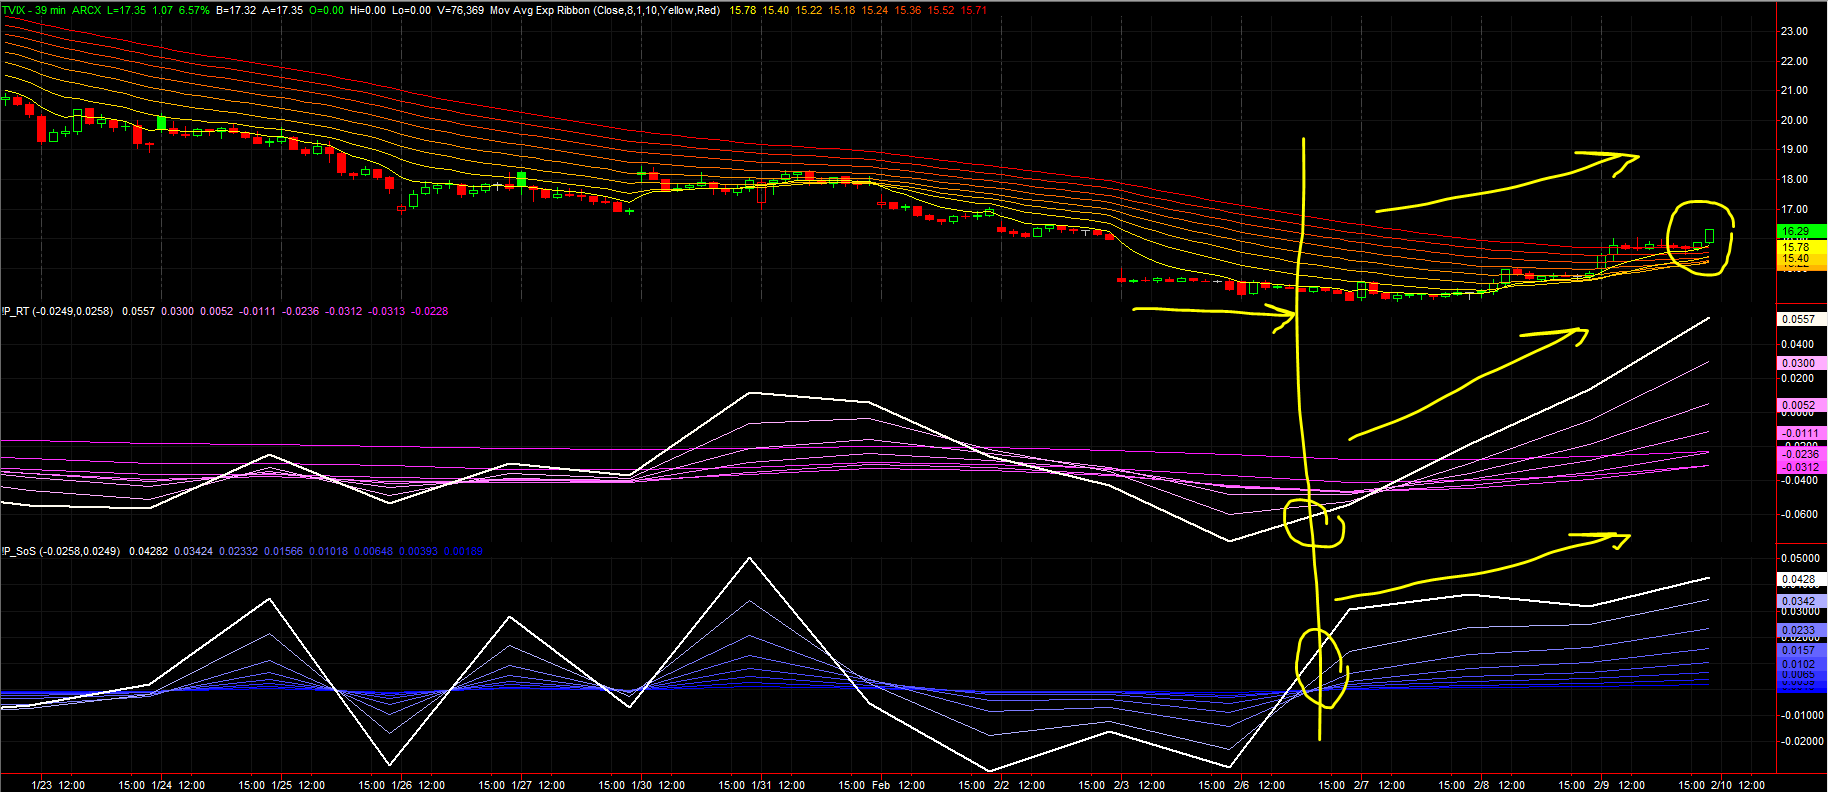
Note that TVIX has been holding a floor in value through 2/7, and on 2/8 started to move upward. Note that the SoS was already VERY positive (perhaps too much so), and now the slopes are off the to races. Only the shorter slopes are positive at this point, so we are early, but we are solid in the upward movement.
Also note that TVIX closed above the ribbon of MAs, which it has not done since before 12/8. This is bullish for TVIX, bearish for the markets, and it will be an interesting exercise to see how this unfolds.
Regards,
pgd
 Posting Permissions
- You may not post new threads
- You may not post replies
- You may not post attachments
- You may not edit your posts
Forum Rules


 Reply With Quote