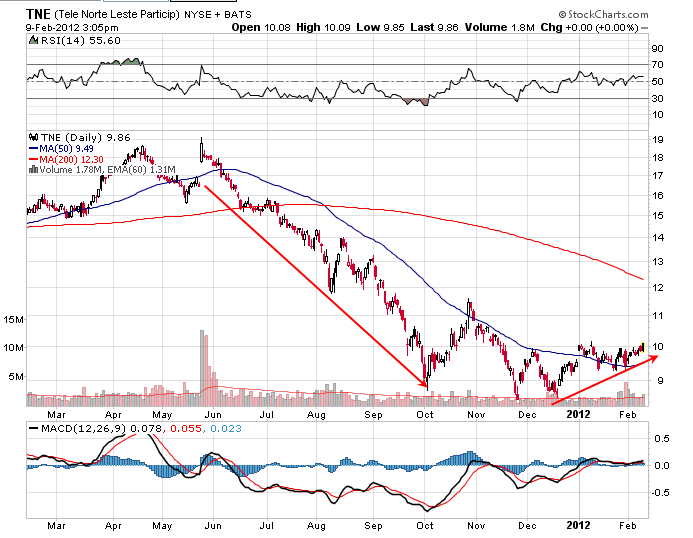
There is an explanation on the www.willain.com web site. Follow the arrow below. These are extracts from the VIT book.
In a strong uptrend, NB is sometimes below LB. This means that there are many traders who want to buy the stock. they do not wait for it to "come back to value".
The same is true in a strong downtrend: everybody wants to sell and hence every little bounce is sold into. As a consequence, NB is above UB. This is the case for TNE. The AB have been fixed by the strong downtrend. The bounce is now pushing the price slightly above UB, but large players are selling this bounce, which means that there is a great probability that the stock will move back down again. If the bounce continues, that would mean that the character for the stock might be changing and that the stock would start a new uptrend. This would be the case if it is for example "pushed" up by the general market.
Sorry for the brief reply.
Pascal


 Reply With Quote