Bwld
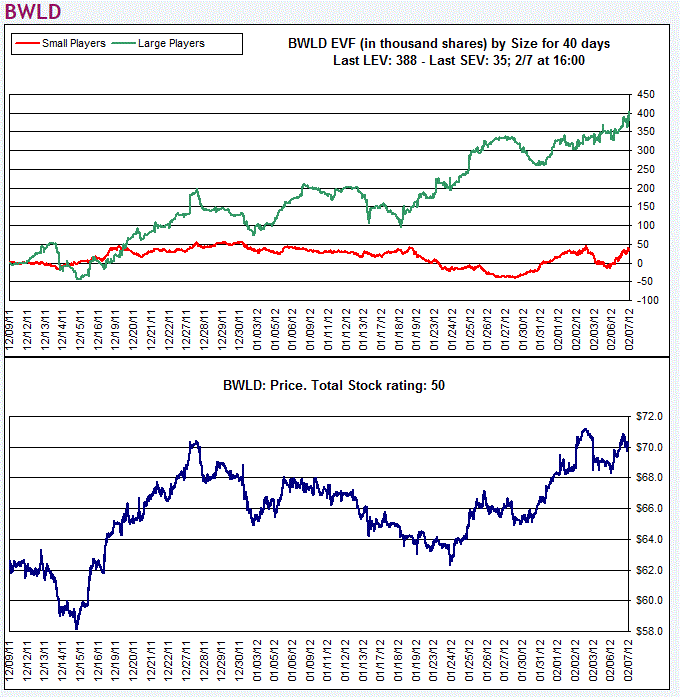
I bought BWLD and decided to hold through the earnings report. Partially because I liked the LEV setup. It appears that large players have consistently supported BWLD, it has been basing since last July which is plenty of time to put gas in the tank.
BWLD is in an IBD industry group that is not particularly strong with a group rating of only 61. This means that 39% of the groups are performing better than the Retail-Restaurants group. When I see a low performing group I do a check of other stocks in the group. If I find at least two other stocks in the group that have both high EPS rating and high RS rating I call that group confirmation and conclude that the stock is not a lone wolf. BWLD is in the same group as PNRA which has an EPS rating of 96 and an RS rating of 96. PEET is the other member that has high RS and EPS ratings.
If I had not built a cushion in my portfolio I would not have taken the risk of holding through the earnings report.

Mike Scott
Cloverdale, CA


 Reply With Quote

