[Hi Jerry and Mike,
For a B8 signal, my notes show: "B8 = Market makes a new high (a higher than the last marked high on MS chart) (per M Scott 10/24/11)" and "Note, the way MarketSmith and WONDA marks significant highs and lows on charts is that the labeled date must be the highest high or low within 9 days looking both forwards and backwards. This relates to buy signal B8 and sell Signal S12. (per M Scott 10/24/11)"
Could you guys comment on whether B8 applies for Jan 3?
Also, I find Jan 3 interesting b/c 20D MF shows -17.5% Day MF Strength and the daily highs on IWM and $COMPQ came at 9:40 AM or so; I believe essentially the big gap up was sold into. This has the feel of a reversal and perhaps some form of subtle stalling.
I reviewed M Scott's notes on stalling, and I gather in the event of an up day of > +0.4%, and the Market Exposure would never claim stalling on such a day no matter how extreme the reversal (I would not call Jan 3 an extreme reversal).
Thanks in advance,
Shawn]
Shawn,
The last NASDAQ marked high was on 12/5/2011. There was a more recent but not marked high on 12/27/2011. The reason that day is not marked is there have not been nine days after that high since making a new high on 1/3/12. So we don't have a NASDAQ B8 signal yet until we close above the 12/5/2011 high. The S&P500 however did close above the last marked high and if that were the controlling chart we would have been talking about a B8 signal. In general we shift to the NASDAQ chart as soon as we can after a FTD on any index. The NASDAQ is considered the more important index in the current era for CANSLIM investing. Billy reported correctly the current Market School count of +4 after yesterday's B6 and B2 signals. In general this is a positive development but we must keep an eye on what is happening to leading stocks.
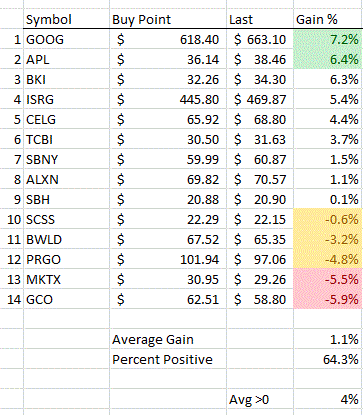
Relating to your stall day comment, yes, no matter how much a day looks like a reversal day, if the index closes up 0.4% or more from the day before it will not be flagged as a stall day. If we had made a 13-week high and closed in the lower 25% of the range on above average volume we would have seen an S11 signal. This does not mean that yesterday's gap up wasn't sold into and we should take a cautionary stance. In addition the NASDAQ gapped right into 200-day resistance and stopped in its tracks. Generally when I see caution signs in the market I look to the action of leading stocks. When I look at leading stocks I believe yesterday showed some negative action. For example QCOR, TSCO, AZO, SWI and TDG have run into possible trouble. PNRA, SCSS and BWLD was sold yesterday. This is not positive action, GOOG and TCBI acted okay. If the market is going to turn downward here we will quickly see sell signals show up in the exposure count. I placed a view below after yesterday's close of stocks that have recently broken out. Five of 14 are negative, not quite what I would like to see.
By the way, since I posted about stalling I have learned something. The stall definitions I posted included simple stalling and two rare stall day definitions. What I learned is that the rare stall day definitions need to meet all of the requirements of simple stalling with the singular exception of the closing range requirement, then apply the rare definitions for the different closing ranges.

Mike Scott
Cloverdale, CA


 Reply With Quote


