+ Reply to Thread
Results 1 to 4 of 4

Thread: Transports showing strength

  1. #1
    Join Date
    Dec 1969
    Location
    Tarzana, CA
    Posts
    962

    Transports showing strength

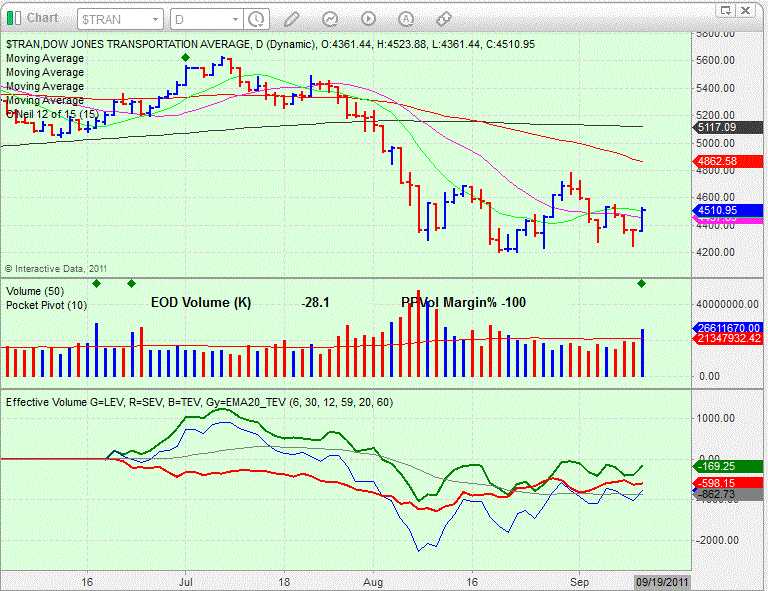
    Some may remember that I was using the Dow Transportation index as a leading indicator last July for where the market may go. The $TRAN broke to a new 52-week high and if it had held my expectation was that the rest of the market would follow. What it did instead was immediately break down and led the correction downward. It was an early warning that the market advance was over. It has corrected 25.3%, more than the general market. Yesterday the $TRAN showed greater strength than the market. This may be nothing more than a bounce play however the situation bears watching. I will take notice if the transports continue to show strength. IYT is the most liquid ETF that tracks the index. My eSignal service reports volume on the index. The attached image shows a generally constructive Large Player Effective Volume picture for the transports. The green line is LEV. I also note that the index generated a pocket pivot buy point yesterday. The green diamond shape above the volume bar shows the automatically generated pocket pivot signal. I don't always follow the transport index, I generally look for what ever index is leading and use that as a guide for the rest of the market. I think the transports may still be in the leading mode.
    Yesterday UAN broke out of a 7-week cup with no handle base. UAN is a recent IPO in the fertilizer space. It closed 1% above the pivot point yesterday. CF and TNH, in the same industry group have ideal price and volume action and are good examples of what is leading the market at the moment.
    Name:  $TRAN.GIF
Views: 1243
Size:  126.3 KB
    Mike Scott
    Cloverdale, CA

  2. #2
    Mike, any thoughts here in terms of current set up of this indicator?

    Weekly Coppock indicator within +/- 20 days of signaling a buy. FreeStockCharts.com is where you can see this on a chart. *I first considered the Coppock as a Voodoo indicator, right up there with phases of the moon defining when gold prices trend will change. That is until I back tested it. I suspect that the weekly Coppock tends to signal perhaps when a lot of bases are ripe for breaking out.

  3. #3
    Join Date
    Dec 1969
    Location
    Tarzana, CA
    Posts
    962
    The NASDAQ Weekly Coppock could have bottomed. It depends on the Friday close.
    In studies of past follow-through days a weekly coppock buy signal (closes up 1 point or more after a bottom below the zero line) that occurs within 20 trading days of the FTD are much more likely to produce a significant rally. Friay would mark 17 trading days since the 8-23 FTD. There is something about the dynamics of the curve that seems to match the need for the market to trade sideways after a significant drop before the market is ready to move up again. In short it seems to match the bottoming process well. The weekly time frame is shown here which matches subsequent rallys of at least 9 or 10 weeks or more in length. If you look at the monthly time frame I conclude that we are no where near putting in a bear market bottom. This could come middle of next year perhaps. So I conclude that we might be witnessing a tradeable bear market rally with knowledge that most bear market rallies tend to fail.

    Below is the freestockcharts.com setup on the NASDAQ.

    Name:  Weekly Coppock.GIF
Views: 1161
Size:  82.1 KB
    Mike Scott
    Cloverdale, CA

  4. #4

+ Reply to Thread

Posting Permissions

  • You may not post new threads
  • You may not post replies
  • You may not post attachments
  • You may not edit your posts