9/1/11 Comments
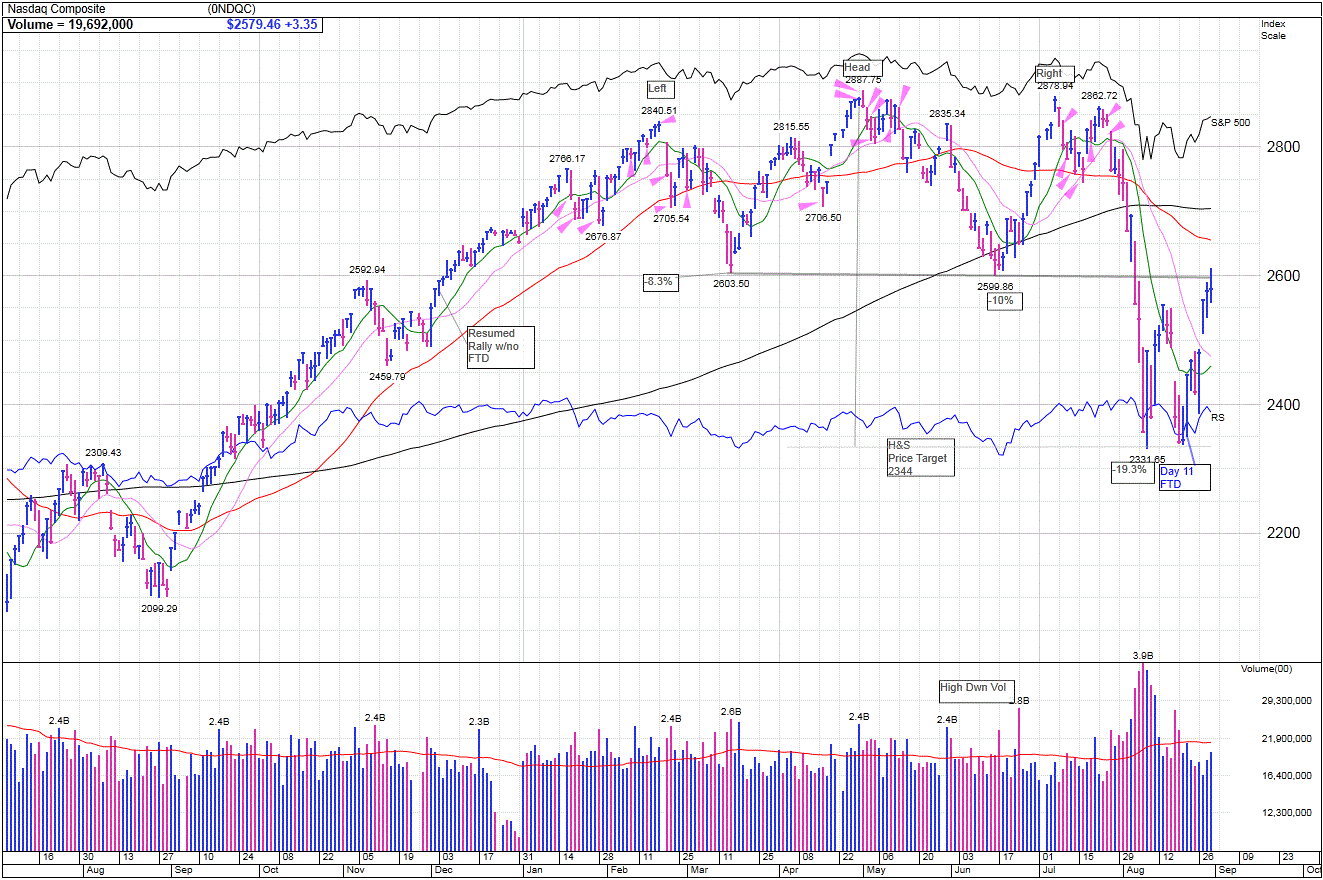
Part of the reason I started to test the short side yesterday can be seen in the attached chart of the NASDAQ. The 0.1% increase yesterday on higher volume is a subtle form of distribution. Jerry posted the leaders index. It was obvious that leading stocks were struggling yesterday also. On the chart you can see the neck line I drew on the head and shoulders pattern. Notice that the NASDAQ was possibly stalling as it rallied into the extension of the neckline. This is one of the classical stall points in a market if it is going to fail. We don't know it will fail here so I will tippy toe in on the short side.
One other point I will make that has nothing to do with testing the short side yesterday is shown by the construction of the H&S downside price target marked on the chart. Notice my price target of 2344 which was created by measuring the hight of the head above the neck line and extending it equadistant below the neck line. The market found support right there when it turned and rallied.

Mike Scott
Cloverdale, CA


 Reply With Quote