Forum Clusters 110812.xlsx
The GDX trade was entered at the open (58.96), found quick support at the 200-day moving average (58.01) around the mid-point of the first support cluster and finished its first day in the green. Not bad considering the revised margins on gold futures and gold weakness for most of the day.
The stop for the initial position (54.41) is very well protected under two strong support clusters. But an exit on a PM 20 DMF signal change is most likely at this stage in the trade. That’s why today’s buy limit entry (59.04) is also safe. This trade will likely become a big success if and when QS1 and SS1 (62.12) are decisively conquered, because there is very little floor resistance left above.
I was one day too early in anticipating the death crosses that will certainly occur today and will be widely commented by others over the weekend.
If there is one indicator that is becoming essential in day trading this HFT-driven market, it is certainly cumulative $TICK as simply following its trend (higher highs-higher lows) and moving averages would have kept you on the right side of the trade for all of the day with huge gains. But it remains a one-day at a time affair with big overnight gap risks.
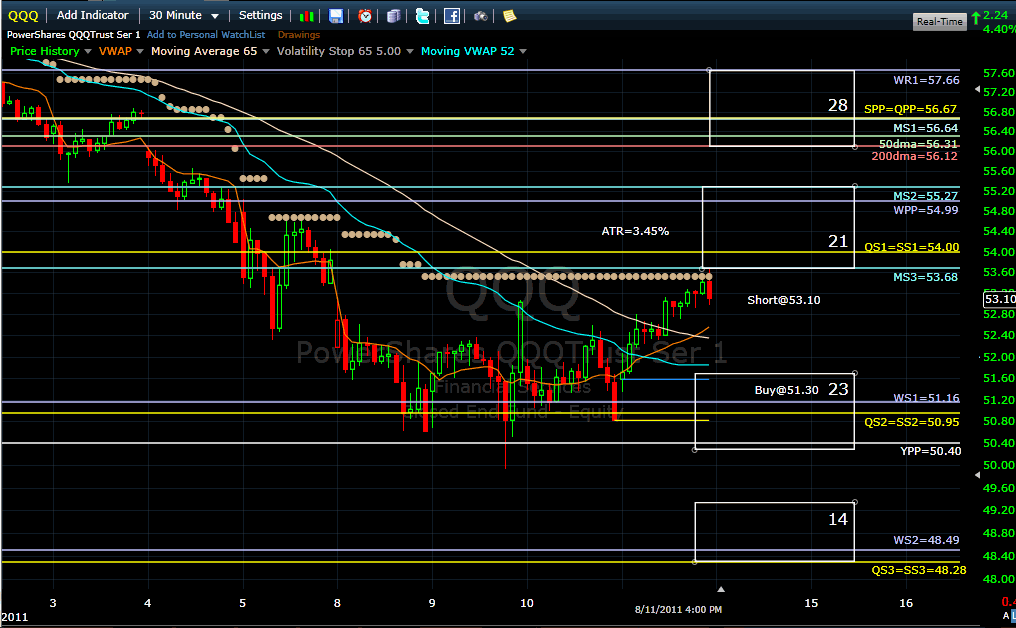
These HFT moves look very suspect to me as they have been unable to trigger any 20 DMF buy signal. Large players are clearly avoiding falling in an artificial rally trap and are perhaps the engineers behind the lure, waiting in ambush to suddenly unload positions massively again. IWM briefly reversed the 65,5 volatility stop before closing under its old limit. SPY and QQQ reversed exactly just before their own volatility stops could react. This can only be interpreted as yesterday’s gain being extreme, but just “normal” under current volatility. Only a solid follow-through could prove the contrary. This extreme volatility move should initially trigger new sell orders that are unlikely to help issuing a 20 DMF buy signal today if not strongly reversed intraday.
Billy


 Reply With Quote
