-
Updated Allocations for July 5th
On the heels of Ray's analysis, I thought I'd update the values to see if there is correlation. I did this day-over-day from my last posting, just to see the progression and if daily volatility really moved the values.
Here's the latest correlation matrix:
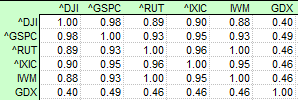
Compared to two weeks ago, which you can view lower in this thread (see entry on 6/21), we've had a slight change but nothing major, as we would expect.
On 6/21 I calculated that the "optimal" levels were 73/27 in favor of IWM; this week the levels have moved a bit more in favor of IWM and the result is
IWM: 78%
GDX: 22%
In sliding-window backtests of where I use just the dates where the IWM or GDX was long (I haven't added short to the mix), I've seen variations as high as 100% IWM and as low as 62% IWM.
The methods of calculation are very different from Ray's but are in the ballpark, so the 1 part GDX to 2-parts IWM and a dash of lime still holds well.
I'll continue to watch and post these numbers, but based on my backtests, which use 100% invested, as well as just the long side of GDX and IWM, I think the 2:1 IWM:GDX is a good overall mix for "being in the ballpark".
 Posting Permissions
- You may not post new threads
- You may not post replies
- You may not post attachments
- You may not edit your posts
Forum Rules


 Reply With Quote