


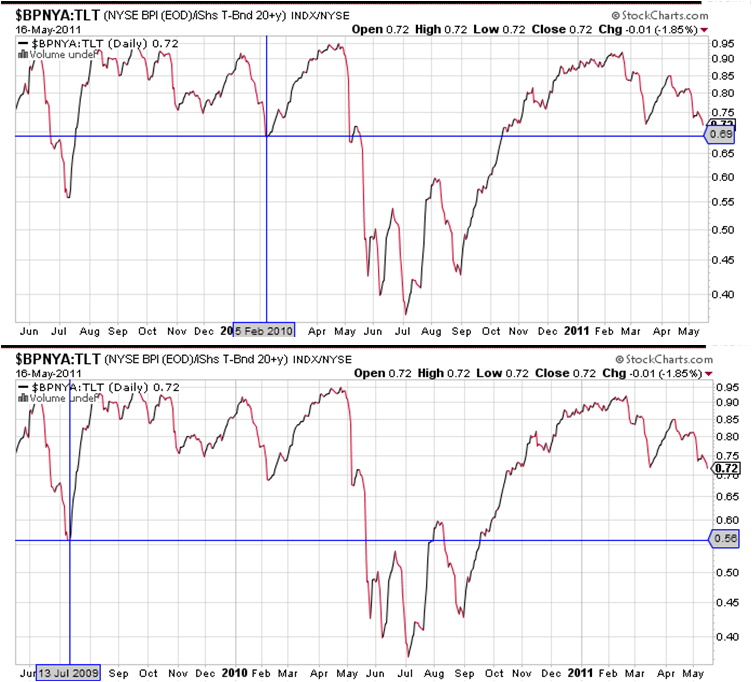
Below is the simple ratio of the Stockcharts.com NYSE Bullish Percent Ratio ($BPNYA) divided by the share price of the TLT long-dated US Treasury ETF through today, which I referred to as a "POMO Oscillator" in a previous VIT post here.
It shows the two lowest dips in the ratio during POMO-active regimes, in July 2009, and Feb 2010.
(To repeat for those who may have missed this first time around - the ratio is not intended as a trading tool per se - our hosts here have that covered - but as a diagnostic for revealing market acceptance or rejection of FED Large-Scale Asset Purchase Program ("POMO") induced asset substitution effects which many believe have resulted in over-pricing of US equities in general. The search for the ratio was inspired by the practical math and active boundary concepts of Pascal's book. POMO-active periods are revealed to indulge price-to-perfection equity/long bond price behavior, represented by a bouncing-off-of-0.91 topping of this ratio, similar to an upper active boundary; while POMO-dormant periods have been erratic around the 0.40-0.60 AB-like band.)The ratio is approaching the first of its previous lower test levels, at 0.69. Its utility in diagnosing POMO-induced behavior would be strengthened if the 0.69 level first, or the band between it and the 0.56 level second, were to hold as support, followed by a return, however jagged or direct, to the 0.91 upper boundary. If both levels are broken downward, it would suggest that POMO-induced asset substitution effects were being unwound early - an important pre-cursor to a longer period of POMO-off volatility for equities which would likely persist until the FED signals toward some kind of QE3, or US macro data returns to significant positive surprise levels.
As an aside to our hosts, the new forum tools and features are far superior to Google's (no offense to employees or investors of GOOG); the system response is superb, and the structure makes perfect sense. Also I'm net long with TZA (3X short $RUT), in agreement with the robot. Thanks for all this work. Well done.
 Reply With Quote


