+ Reply to Thread
Results 1 to 9 of 9

Thread: IBD Accumulation/Distribution Ratings Evolution

  1. #1
    Join Date
    Dec 1969
    Location
    Brussels, Belgium
    Posts
    1,999

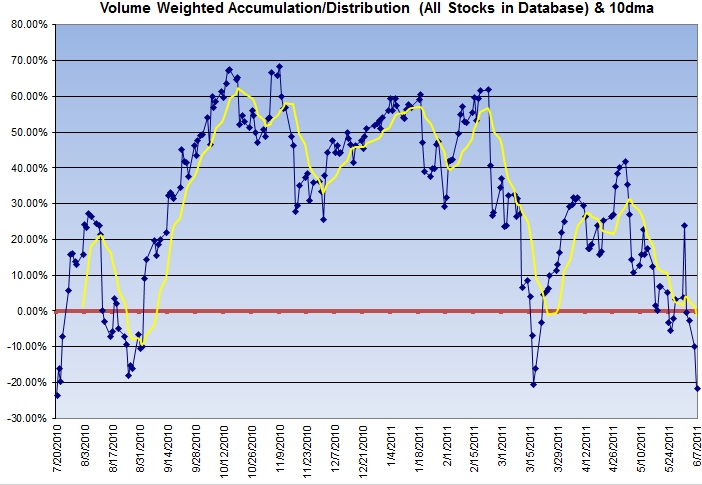
    IBD Accumulation/Distribution Ratings Evolution

    No Comment...

    Name:  IBD110607.jpg
Views: 4672
Size:  142.5 KB
    Name:  IBD110607-2.jpg
Views: 4679
Size:  199.6 KB
    Last edited by Billy; 06-07-2011 at 02:43 AM.

  2. #2
    Quote Originally Posted by Billy View Post
    Billy,


    From your second figure, it seems that all three past extreme oversold situations reversed up exactly at this specific position (-20%). Do you have older data to see if this was also the case in the past?


    Pascal

  3. #3
    Join Date
    Dec 1969
    Location
    Brussels, Belgium
    Posts
    1,999
    Quote Originally Posted by Pascal View Post
    Billy,


    From your second figure, it seems that all three past extreme oversold situations reversed up exactly at this specific position (-20%). Do you have older data to see if this was also the case in the past?


    Pascal
    I have 743 trading days available:

    Name:  ibd110607lt.jpg
Views: 4429
Size:  292.9 KB

  4. #4
    Quote Originally Posted by Billy View Post
    I have 743 trading days available:

    Attachment 8648
    OK. Thanks. SO we can say that since the POMO market began in March 2009, -20% was a place for a reversal, except for the HFT triggered flash crash in May.

    If we break this level here, then we might be in for something stronger on teh downside.
    However, As you wrote yourself some weeks ago, POMO money is staill available and might amplify any technical bounce that is hsaping up in the futures" market.


    Pascal

  5. #5
    Join Date
    Dec 1969
    Location
    Calgary, Canada
    Posts
    18

    POMO sale operations

    I notice that POMO used to have only buy operations, now they have sale operations too.
    If purchase operations pumps liquidity into market, causing market to edge up, does the sales operations mean withdrawing liquidity from the market and cause market to edge down?
    Today is a sales operations day.

  6. #6
    Do you have a link of where to find this buy/sell operation information?

    Thanks.

    Quote Originally Posted by KevinKT View Post
    I notice that POMO used to have only buy operations, now they have sale operations too.
    If purchase operations pumps liquidity into market, causing market to edge up, does the sales operations mean withdrawing liquidity from the market and cause market to edge down?
    Today is a sales operations day.

  7. #7
    Join Date
    Dec 1969
    Location
    Brussels, Belgium
    Posts
    1,999
    Quote Originally Posted by Wei View Post
    Do you have a link of where to find this buy/sell operation information?

    Thanks.
    Here's the link
    http://www.newyorkfed.org/markets/to..._schedule.html

  8. #8
    Thanks, Billy!

    Quote Originally Posted by Billy View Post

  9. #9
    Join Date
    Dec 1969
    Location
    Brussels, Belgium
    Posts
    1,999
    Quote Originally Posted by KevinKT View Post
    I notice that POMO used to have only buy operations, now they have sale operations too.
    If purchase operations pumps liquidity into market, causing market to edge up, does the sales operations mean withdrawing liquidity from the market and cause market to edge down?
    Today is a sales operations day.
    The ongoing POMO program is called “Operation Twist”. The FED is purchasing shorter-dated bonds ( 1,2,3 years) and selling the longer dated (20-30 years) variety. This is depressing interest rates and yields, making riskier asset classes (equity) more attractive. Cost of margin interest is also lower and that’s about the only sure long lasting effect on liquidity. The calendar effect of purchases and sales has mostly an intraday and ultra short term liquidity effect.
    Billy

+ Reply to Thread

Posting Permissions

  • You may not post new threads
  • You may not post replies
  • You may not post attachments
  • You may not edit your posts