-
Long XLU
With the move toward lower rates, money has been moving into defensive sectors.
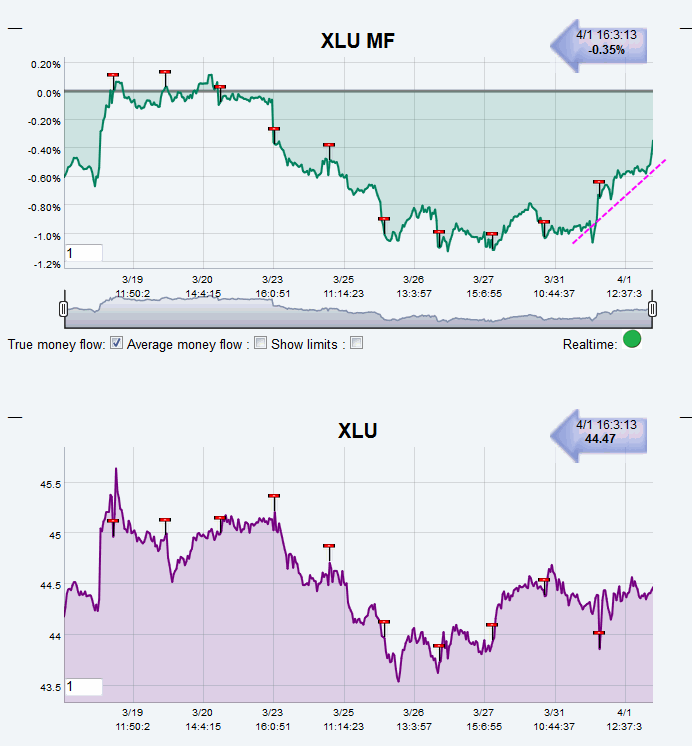
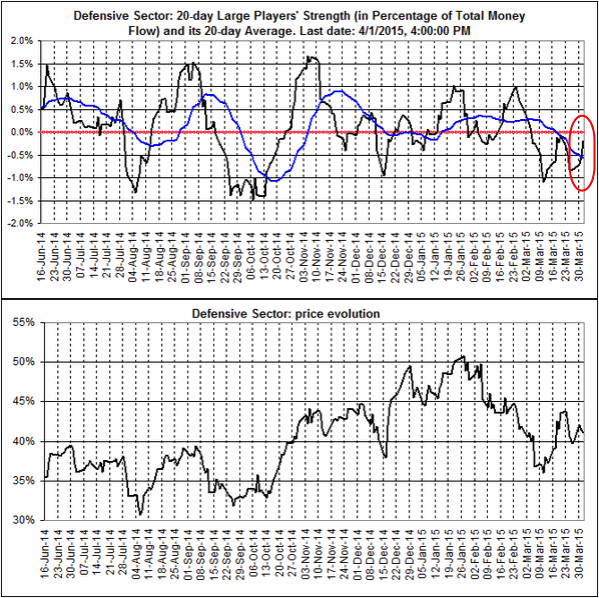
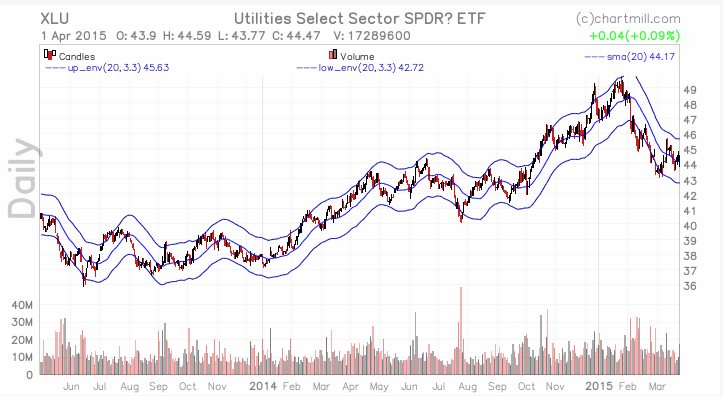
This is an interesting example, because XLU is a slow moving defensive ETF that provides a 3.33% yield.
To trade this type of instrument using the Breakout Calculator, it is important to use a longer analysis time frame.
The idea is to keep the position for more than five days, in order to "ride the trend".
What we need to do is to find the best entry price/exit target, using the Breakout Calculator.
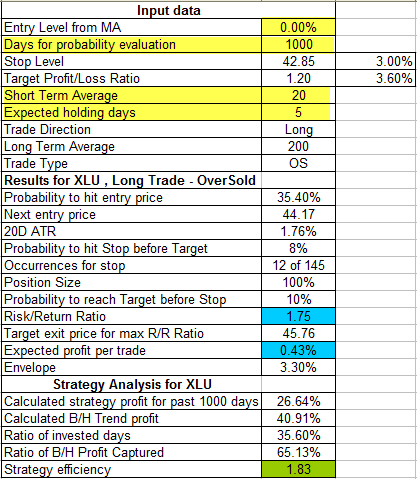
As a first test, I will use 1000 days for back analysis (four years,) a 20 days short term average and a 200 days long term average. However, I am still keeping 5 days as the initial holding period. It is indeed important that the trades work for the initial five days in order for it to work for a longer term holding period.
I will also use an entry level that is 0% from the 20MA.
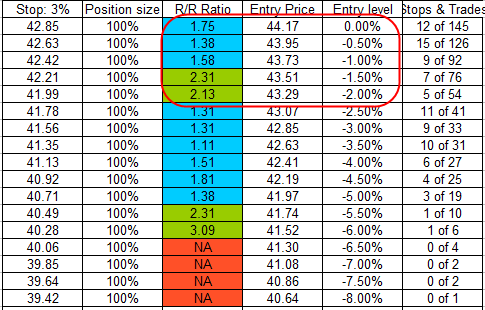
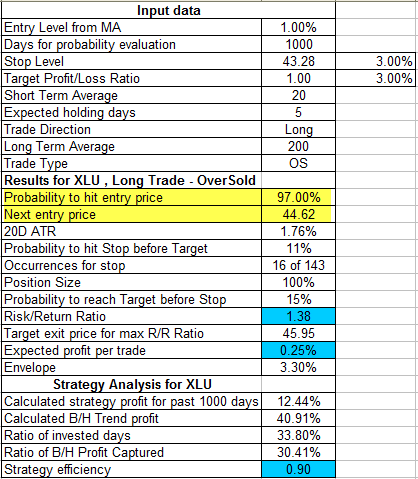
We can see below that the first test is relatively positive, with a R/R of 1.75. This is good for such a low volatile instrument.
The sensitivity analysis however tells us that it is better to buy deeper pull-backs
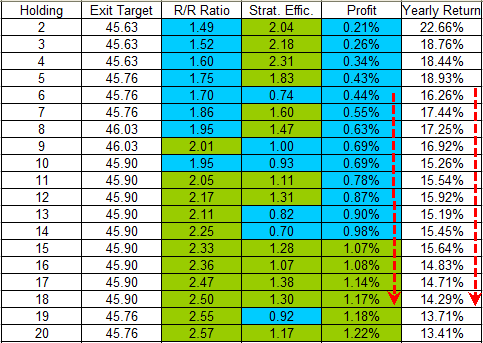
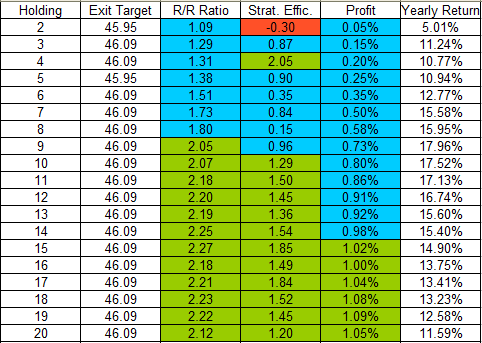
In our case, what is most interesting is to see how the stats evolve with the length of the holding period.
We can see below that if we have as objective to hold the trade for 20 days, the R/R will be better. The yearly profit for that strategy is 13.41%. This is not exceptional, but for XLU, it is just fine.
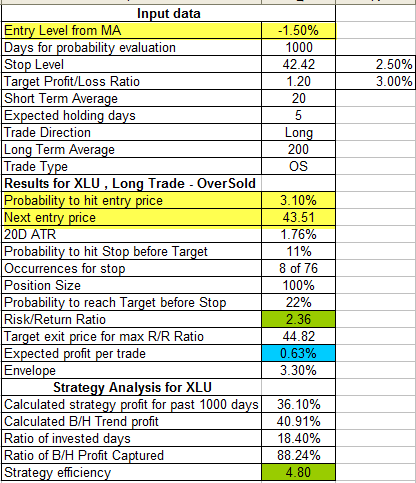
The second test is to try an entry 1.5% below the 20MA.
The results are of course much better, but the probability to reach that price today is 3.1%. This means that we need some patience if we want a better entry.
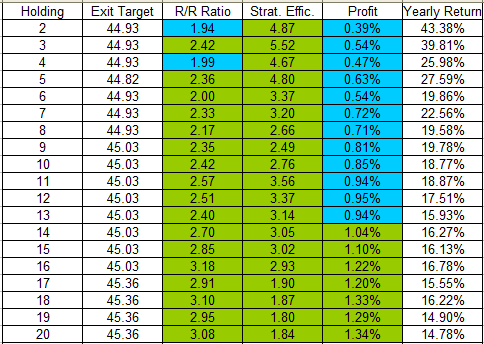
It is however interesting to see that if we wait for a better entry, after 20 days, the yearly return becomes 14.78%, which is not that much better from the expected 13.41% produced by a higher entry.
This tells us that when we want to keep a trade for a longer period in order to "ride the trend", then the entry level is not as critical than compared to short term trade son more volatile stocks.
Finally, we can test an entry at the level of yesterday's close. This is still a good trade!
 Posting Permissions
- You may not post new threads
- You may not post replies
- You may not post attachments
- You may not edit your posts
Forum Rules


 Reply With Quote