Measuring volume for a potential follow-through day
I monitor intra-day volume on the NASDAQ and Consolidated NYSE volume. These are the two volume sources that IBD uses to gauge FTD volume requirements that volume be higher than the day before. The consolidated NYSE volume is used to judge S&P500 FTD volume. They used to use NYSE floor volume but over time this has shrunk to just 20% of the total NYSE volume.
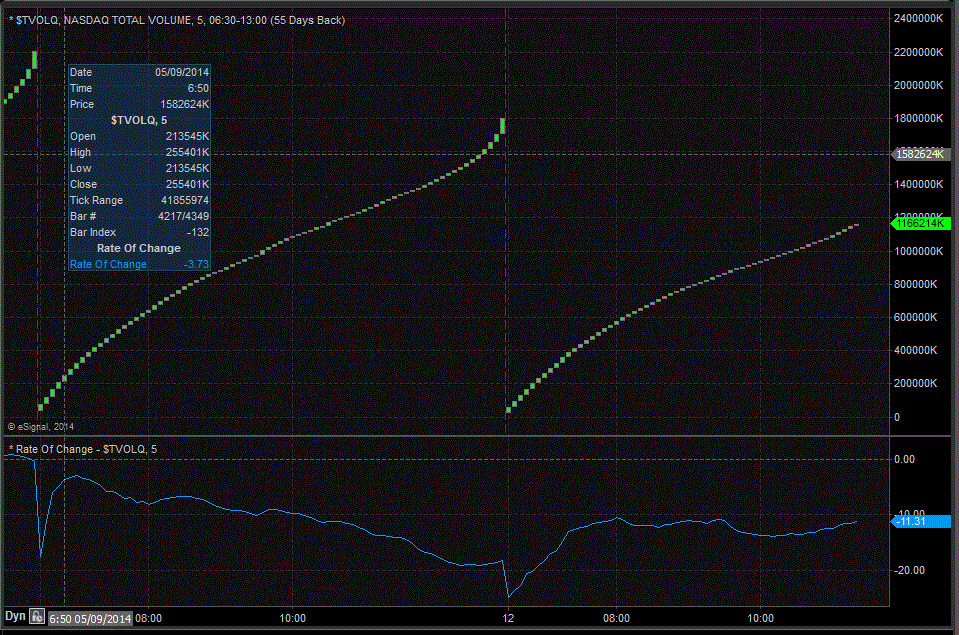
eSignal has a separate symbol for index volume which allows me to quickly see if volume is running higher. I chart volume on a 5-minute interval chart that shows approximately two days of volume. This way I can directly compare yesterday's volume to today's volume at the same clock time. I also run a 78-period ROC indicator which will show the rate of change volume from yesterday's bar equal to the current clock time. A positive ROC means the volume is running higher. There are 78 bars in one trading day on a 5-minute chart if you block out after hours data, something eSignal lets me control. You can see from the chart below that NASDAQ volume running 11.31% lower than Friday at the time of the screen capture.

Mike Scott
Cloverdale, CA


 Reply With Quote