


ok will do :)Originally Posted by Pascal


ok will do :)
no TLB at end of day 2016-05-31.
-> ride on.

Thanks for the update
pascal
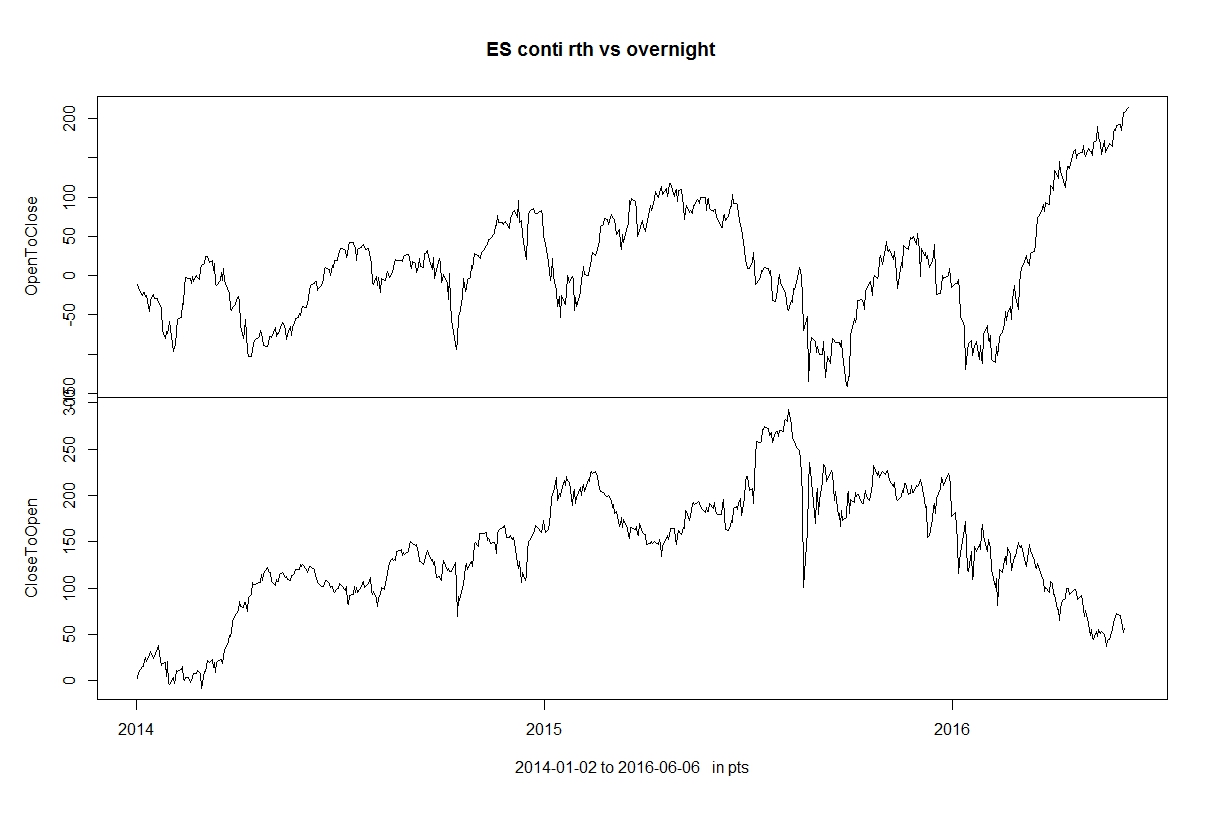
The buying during RTH session goes on.
No TLB.
Thanks Peter.
Keep us posted on this evolution.
Pascal
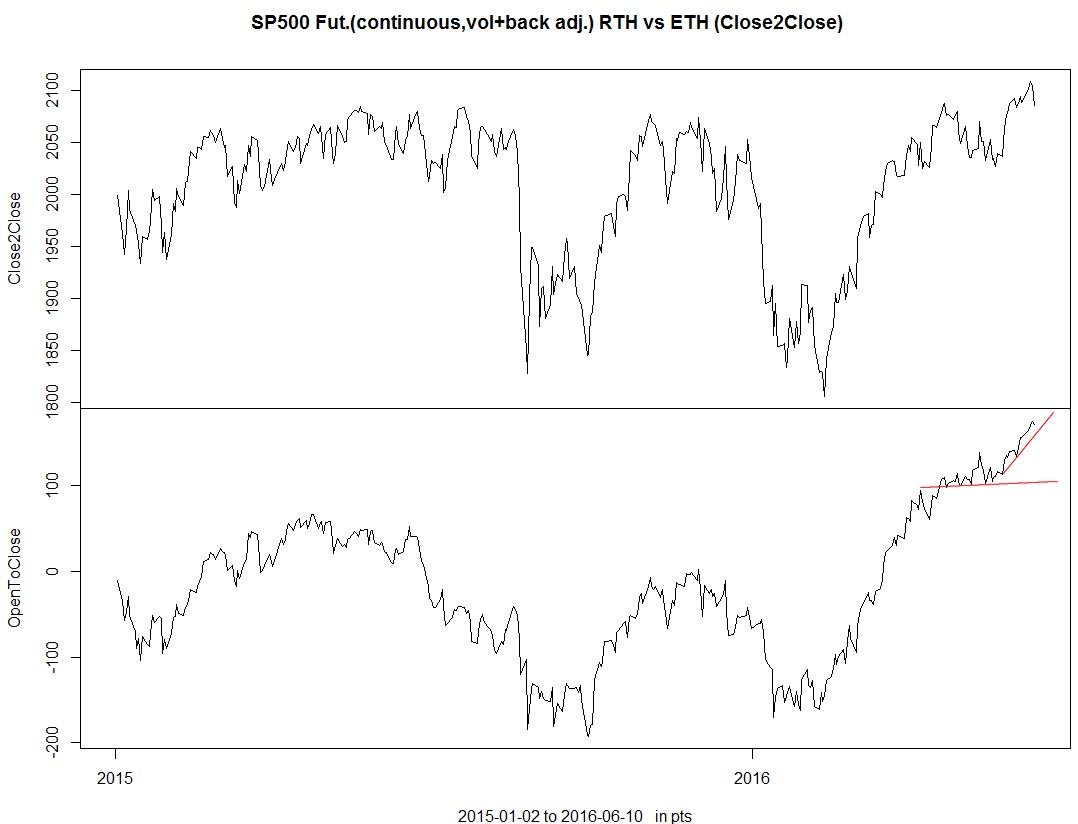
no TLB in today's nearly unchanged RTH session.
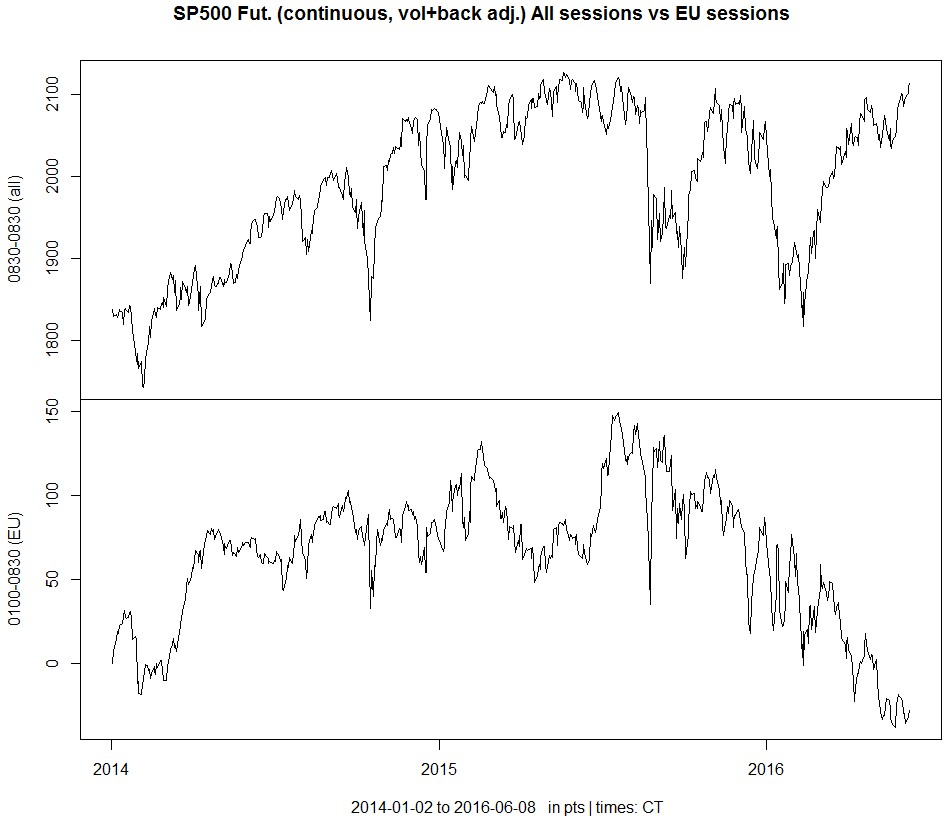
But I looked into the asia- and EU-session separately:
Overnight in asia is mostly flat since start of the year.
Overnight during Europe session is mostly negative.
Conclusions:
1.
If one plans to go long SP500 futures, look for a potential pullback during the EU-session
2.
This is not clearly visible in the charts,
but multiple times in the last days a measured move target (based on some RTH move) was hit during the asia session - and afterwards we got the EU-pullback.
Here is an update that shows the session times I picked.
All times are in Chicago times.
I hope the reader does not feel spammed. But this is a work in progress.
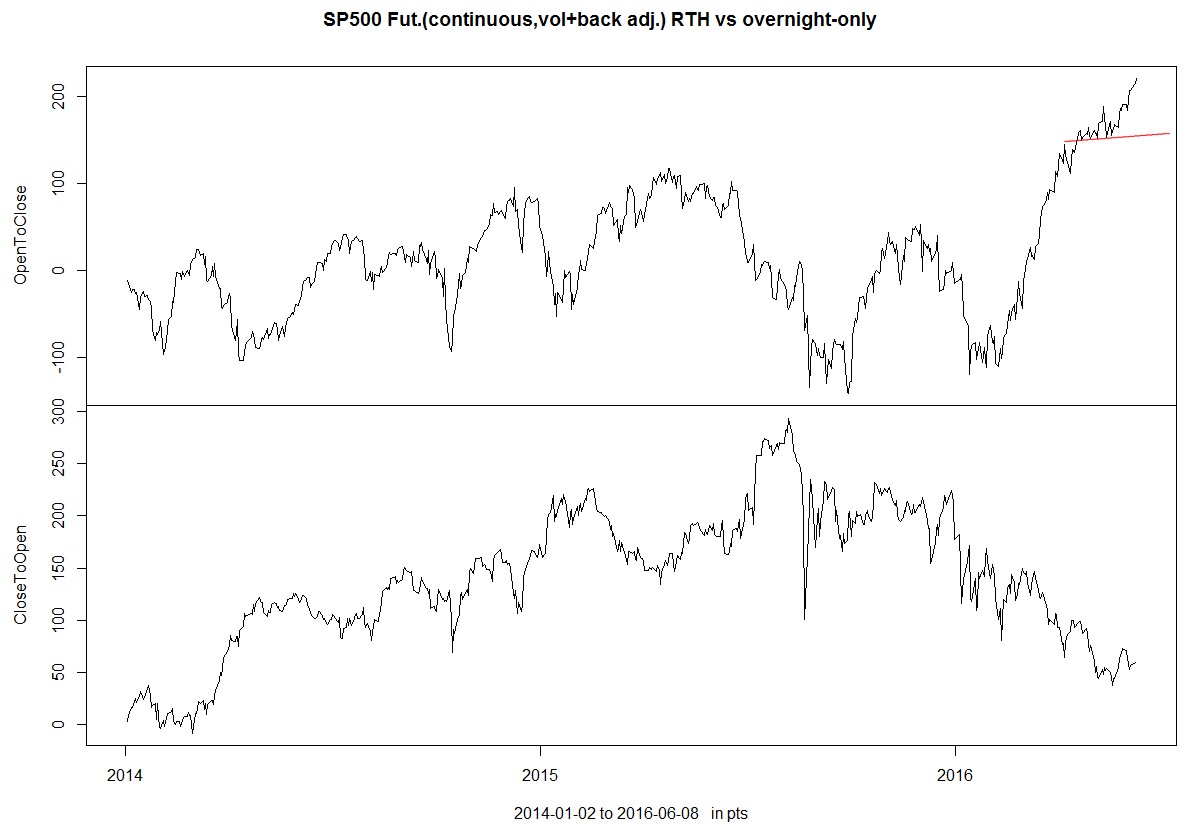
My main purpose doing this, is to better understand when to hold-on to overnight runners and if & when not to.
Pascal's idea to use this for a more macro-view via monitoring a trend shift makes also sense to me (see the discussion below)
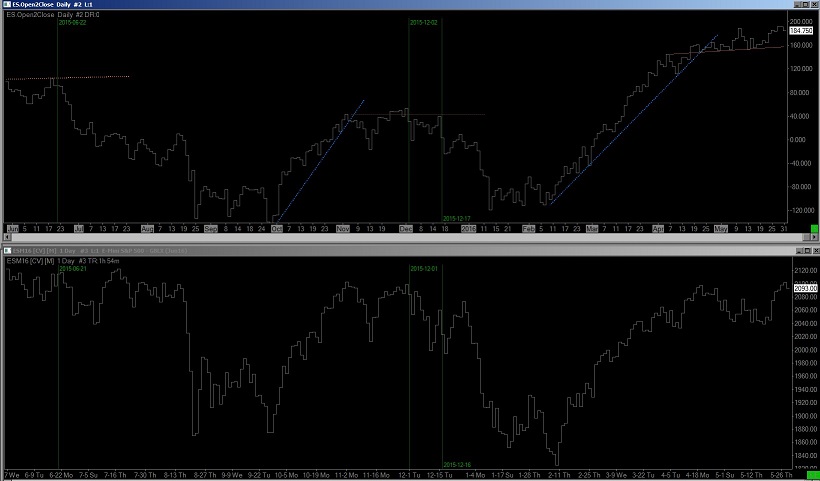
No trend shift. RTH buying continues.
a down day? Not so fast !
The RTH-buying continues.
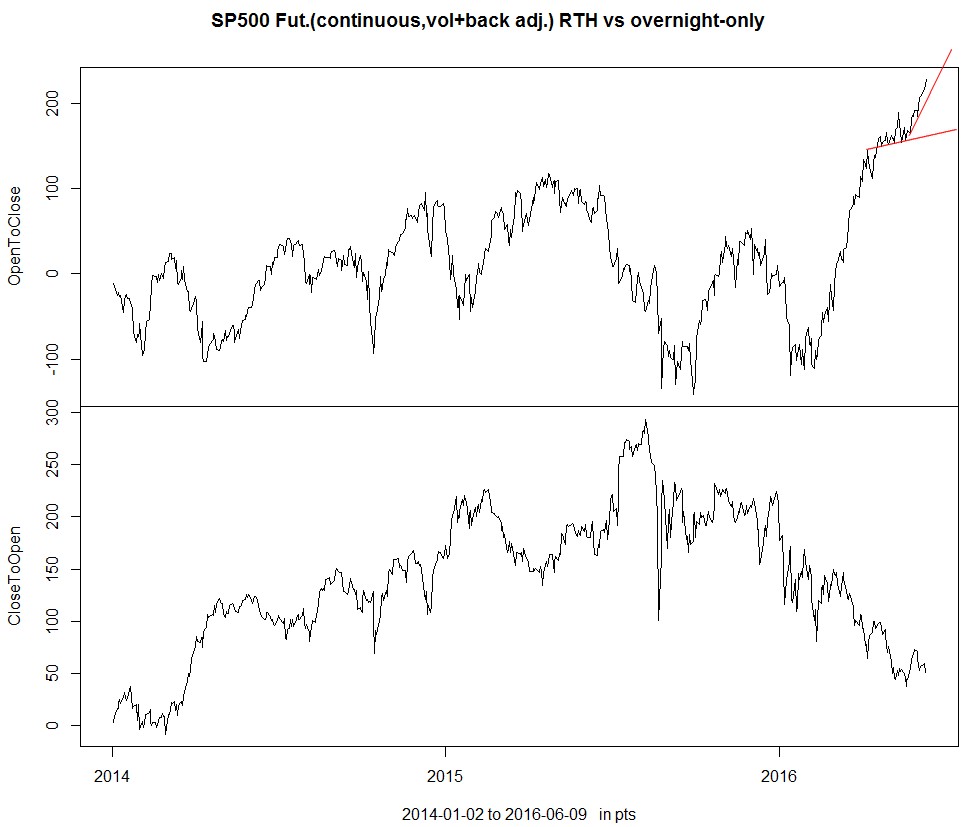
The gap down, caused in Asia and Europe , makes today look severe on a normal chart (upper panel).
On the RTH-only chart it is barely visible.
(I made the scale bigger to see the details better.)
 Posting Permissions
 Reply With Quote