


strong RTH buying again,
after weakness in Asia and Europe

strong RTH buying again,
after weakness in Asia and Europe

Thanks for the update
pascal
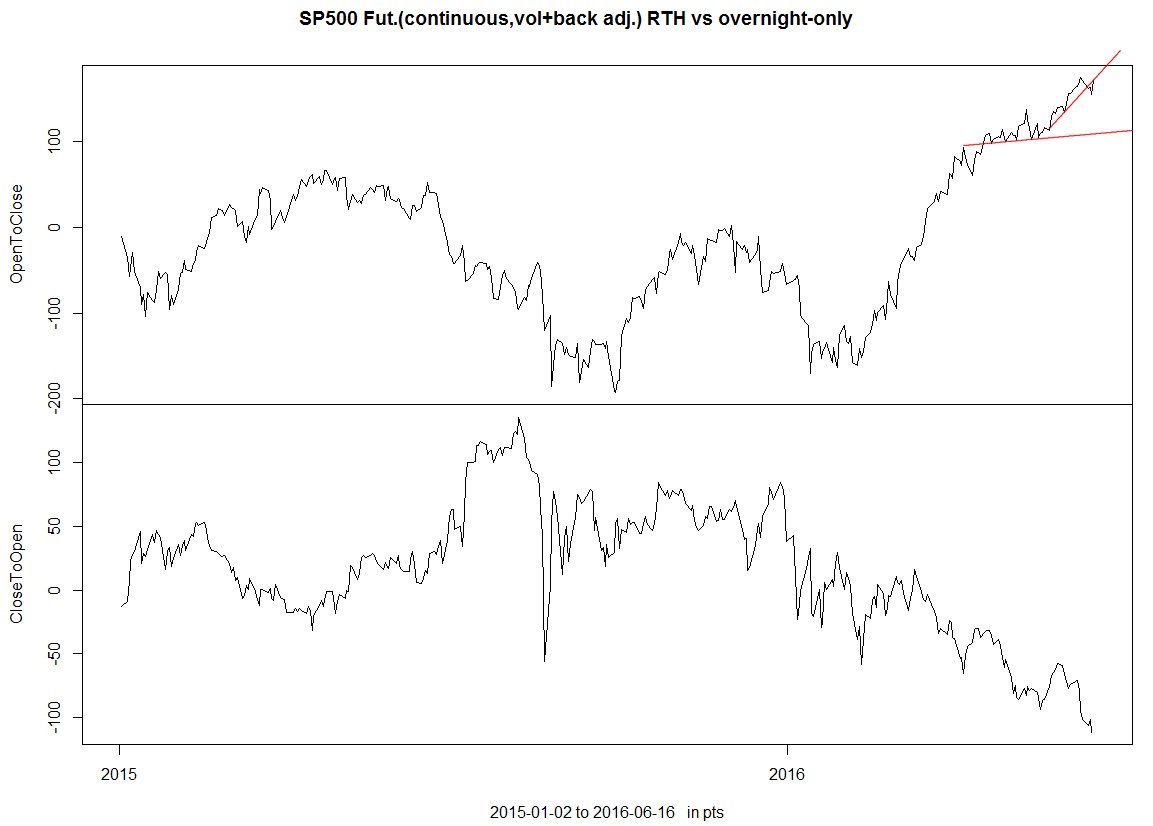
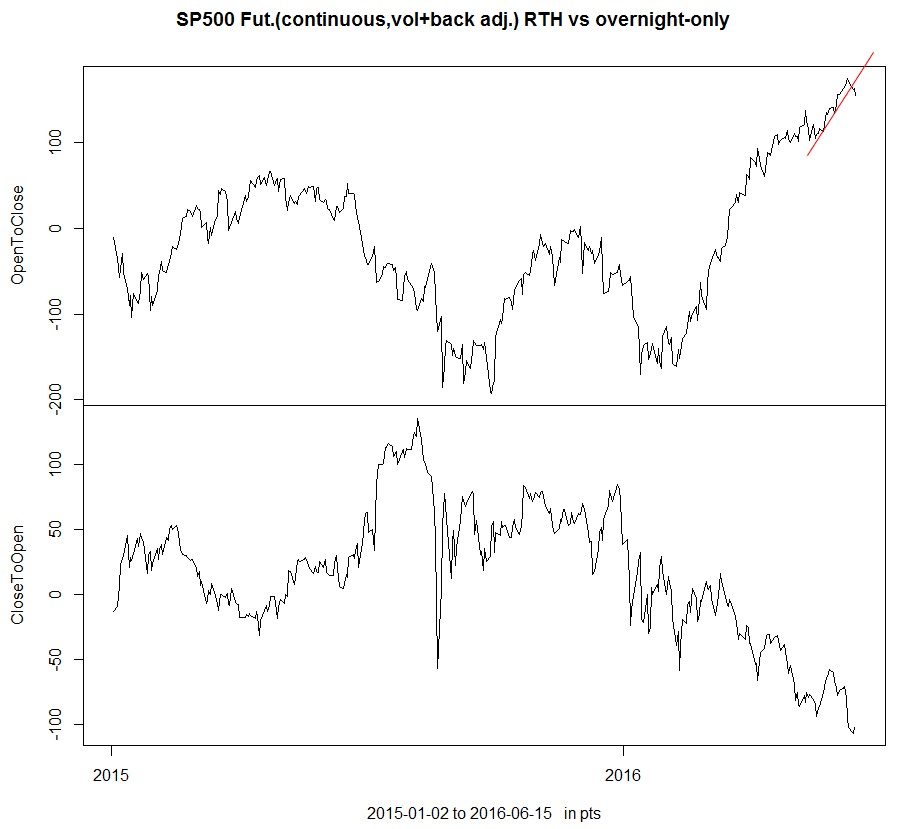
a trend line break
TY Pascal,
The phases you spotted are interesting.
Here are the dates to your trend line breaks.
(It is a bit subjective)
RTH-Buying vs the normal eth time series of the ES futures:
here are the percent returns for the selected dates:
(I hope I have no error in the steps)
here are the means of the above:
I have not adjusted for a buy&hold base line.
And 2x 2 signals overlap.
But I think a trend line break is not a strong enough signal for a short.
Maybe for T+1, but this is more like a momentum play
(going with a breakout for a day).
Last edited by PeterR; 05-23-2016 at 06:08 AM.
Yes, I agree, but it could be a signal to tell you not to be long anymore.Originally Posted by PeterR

Pascal
no TLB in today's nearly unchanged RTH session.
But I looked into the asia- and EU-session separately:
Overnight in asia is mostly flat since start of the year.
Overnight during Europe session is mostly negative.
Conclusions:
1.
If one plans to go long SP500 futures, look for a potential pullback during the EU-session
2.
This is not clearly visible in the charts,
but multiple times in the last days a measured move target (based on some RTH move) was hit during the asia session - and afterwards we got the EU-pullback.
We had some selling rth.
Probably tested the steeper trend line from below.
I don't know how much weight we should give to the daily developments.
IMO key is to spot a change in the general behavior of buying during RTH but selling ON.
This would be a hint that some key players change their behavior for a while.
Pascal identified the NIRP-refugees as a likely dominant group.
I would add pension funds within the US doing something similar to NIRP-refugees: hunting for yield in US equities - or stop doing so for a while.
Aswath Damodaran gives us some equity yield numbers (Implied EquityRiskPremium):
Implied ERP on June 1, 2016=5.03% (Trailing 12 month, with adjusted payout), 6.12% (Trailing 12 month cash yield); 6.16% (Average CF yield last 10 years); 5.54% (Net cash yield); 4.66% (Normalized Earnings & Payout)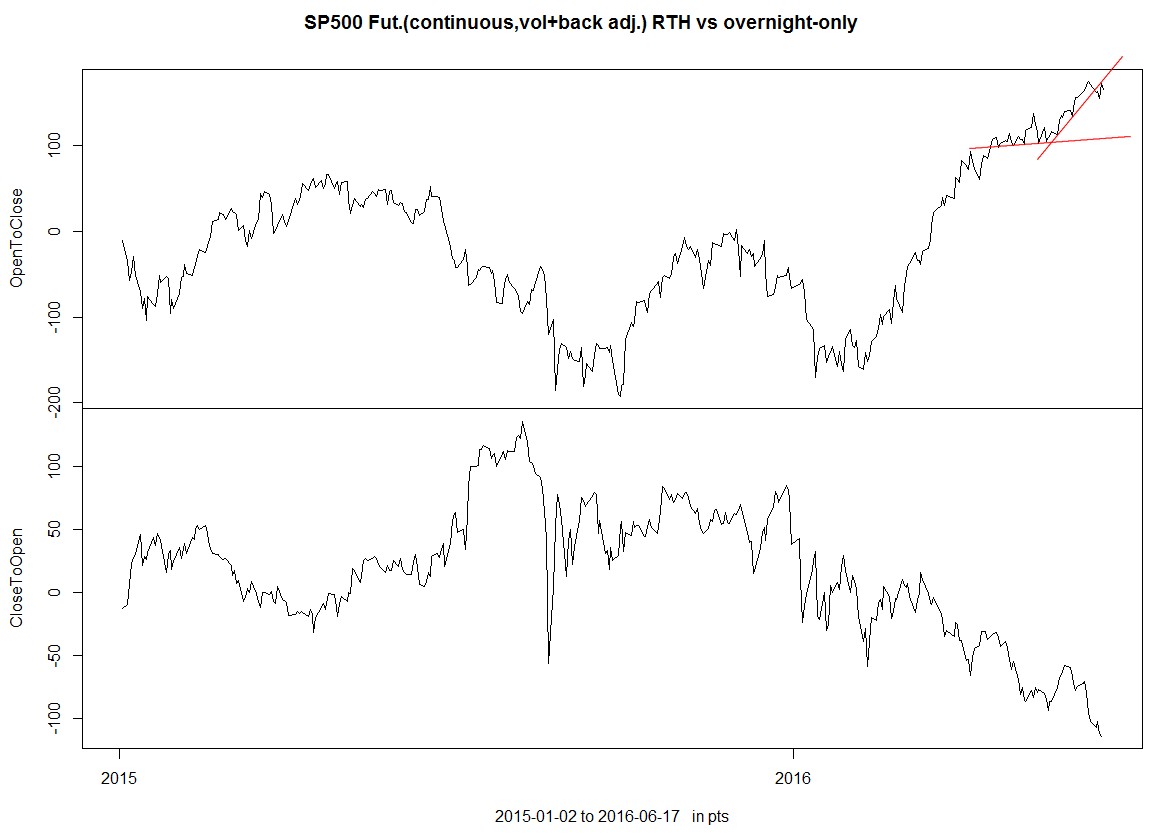
Last edited by PeterR; 06-18-2016 at 01:48 PM.
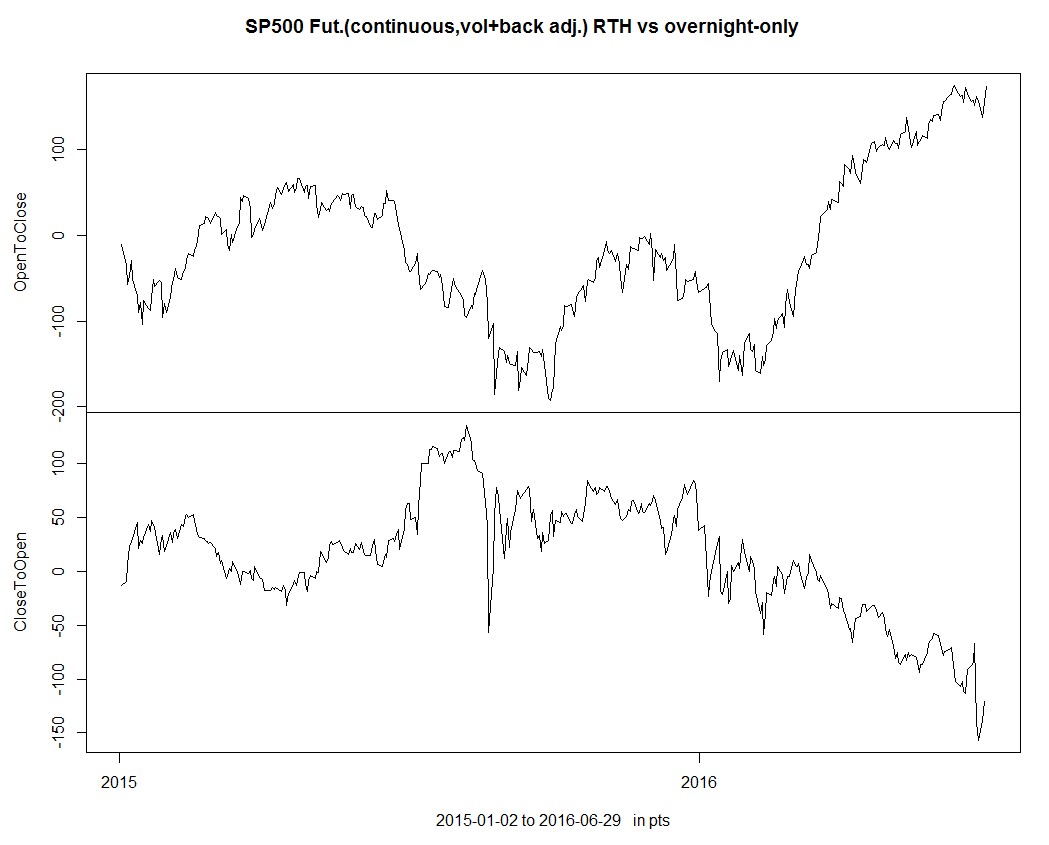
A 2th buying RTH session.
The Brexit event is nearly invisible now.
Thanks Peter.
Keep us posted on this evolution.
Pascal
Yes, indeed... What a strange market!!!
Pascal
 Posting Permissions
 Reply With Quote