4-18-2016 Before the Open
I seldom buy stocks that are not within 15% of a 52-week high. However, some low-in-base set ups look too good to pass up.
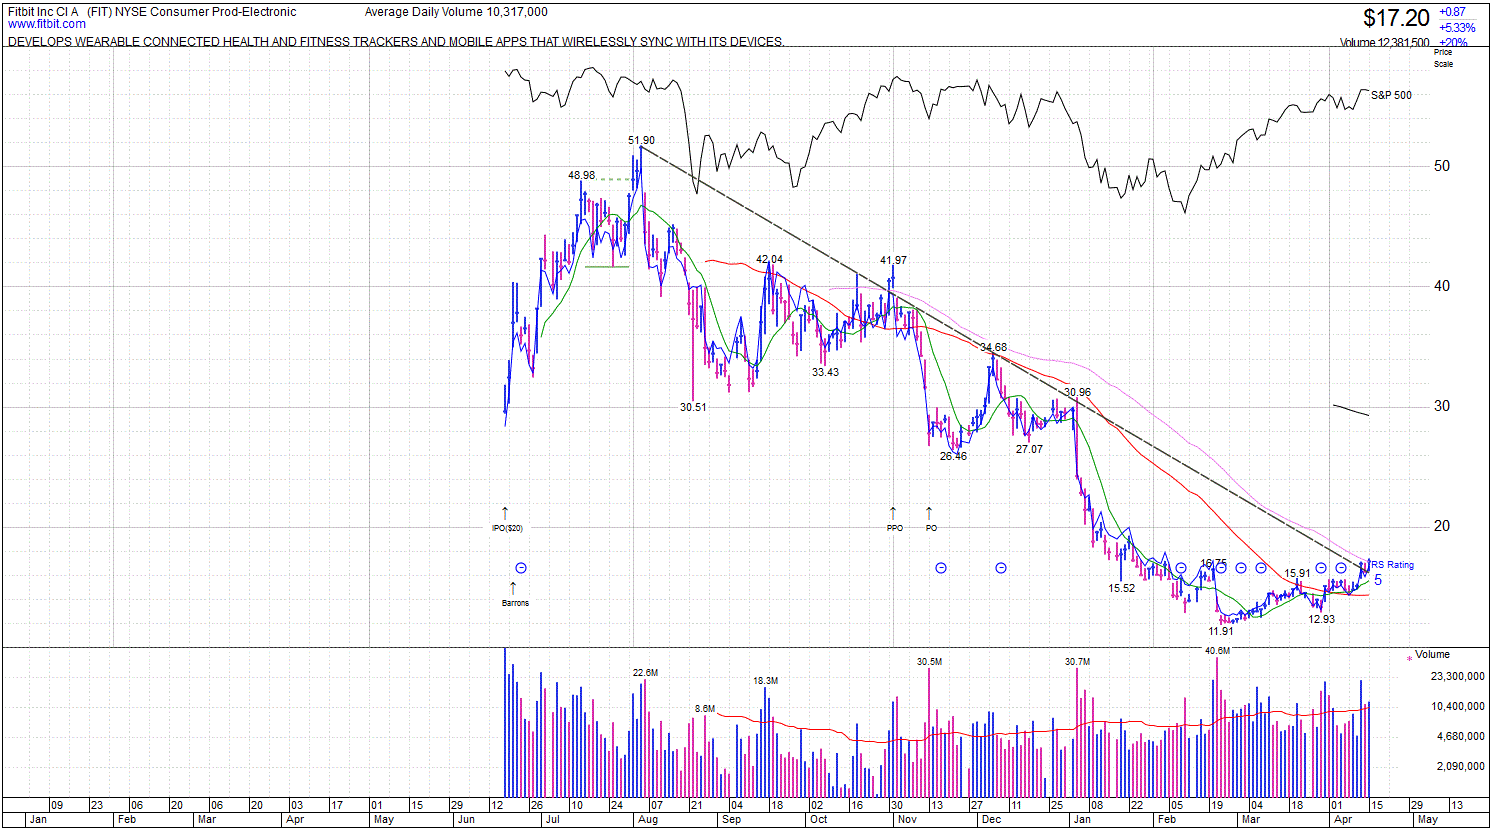
Fitbit (FIT) has earnings growth and has been in a downtrend for nine months. What struck me about the setup was FIT has made three waves down in its selling and then formed a head and shoulders bottom (reverse H&S pattern). It broke above the H&S pattern and above a declining tops resistance line on volume 120% above average volume, where I bought it. That amount of volume behind the breakout may bode well for a rise. I note that significant overhead supply does not come into play until the $27 level ($10 above the current price). So if the market doesn't roll over, I might expect to meet a 50% profit target. And even then, perhaps wait to see what happens at the overhead supply levels. Price is above support at the 50-day moving average, which has stopped declining and flattened out.

I have updated watchlists in the high growth area.
Mike Scott
Cloverdale, CA


 Reply With Quote