Originally Posted by
adam ali

Pascal,
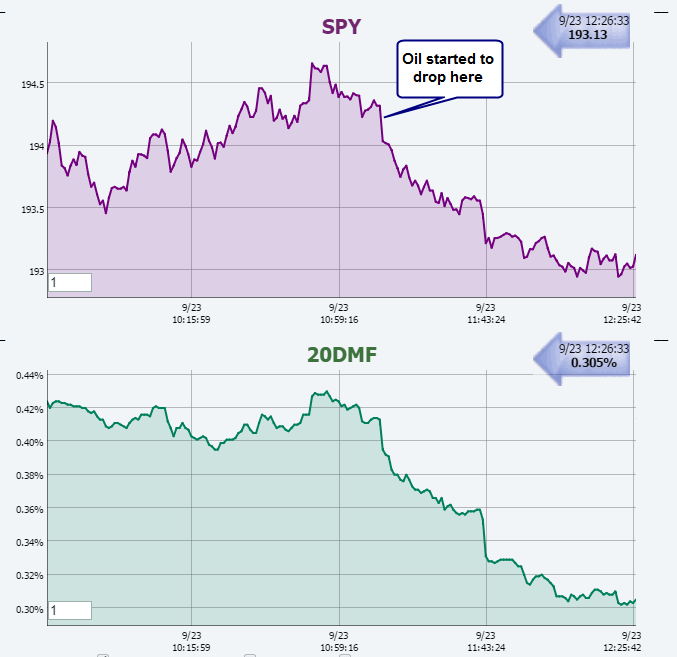
I see the longer-term S&P 500 MF chart on the front page shows a very positive trend since the August bottom even as price declines / moves sideways. One would think that soon price has to reverse back up and get back in synch with the direction of the money flow. However, the chart also indicates we're at or near a point where money flow in the past has turned back down (near the +0.5% level).
What is one to take from this? To me, it's an indication the market can't get out of its own way, even as MF is quite positive, and that when MF does turn back down, look out below.
Thoughts?
Adam


 Reply With Quote