As we can see below, FSLR is sitting on a support zone, with a strong gap just below it.
There are two waves of potential sellers if we break below support
The Pyramid data is rather negative, but the sector itself is still in a long mode
The Table below shows the trade statistics in case of a breakdown below 54.5 on low volume,
while the Table below shows a breakdown on volume.
We can see below that any price below $54.5 can be shorted (As far as the volume is strong)
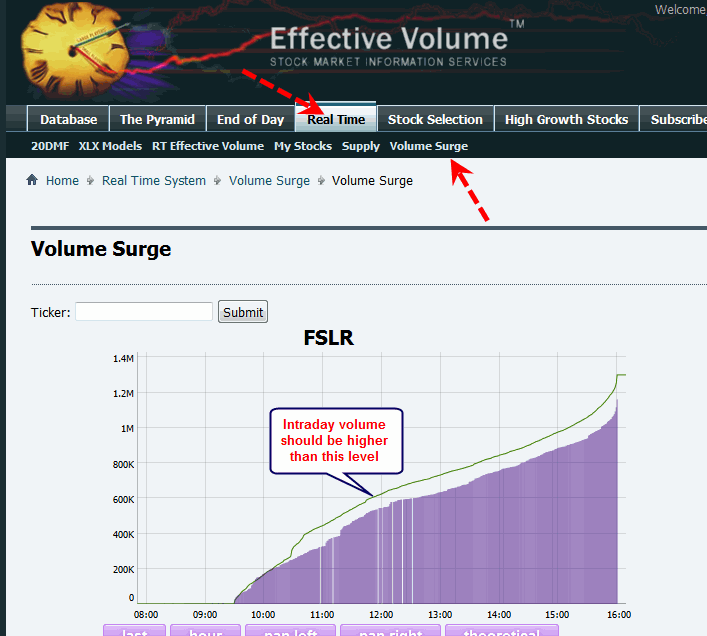
Subscribers to the EV RT can have an access to the intraday volume analysis:


 Reply With Quote