-
Long FMX
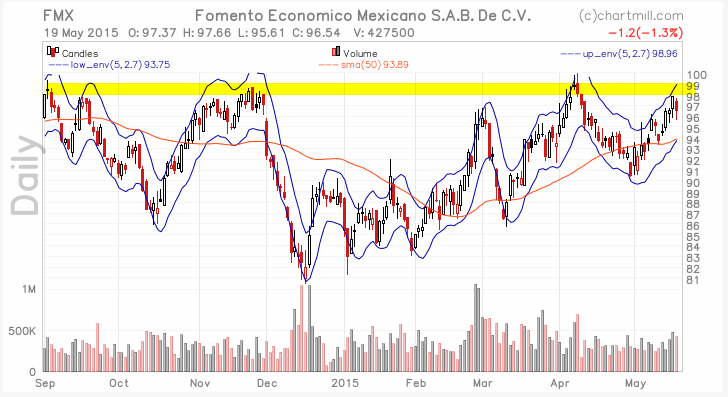
FMX - beverage industry - pulled back somehow yesterday but is in an uptrend, although it is now close to its resistance level.
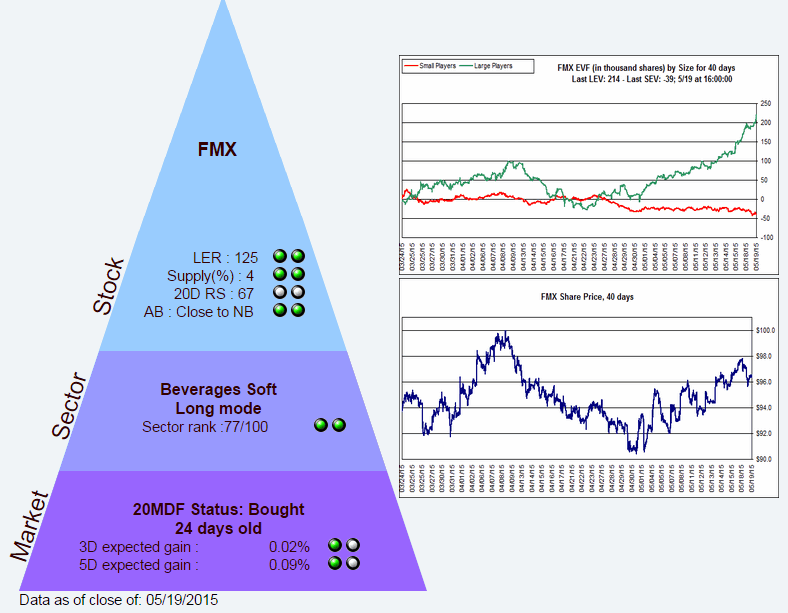
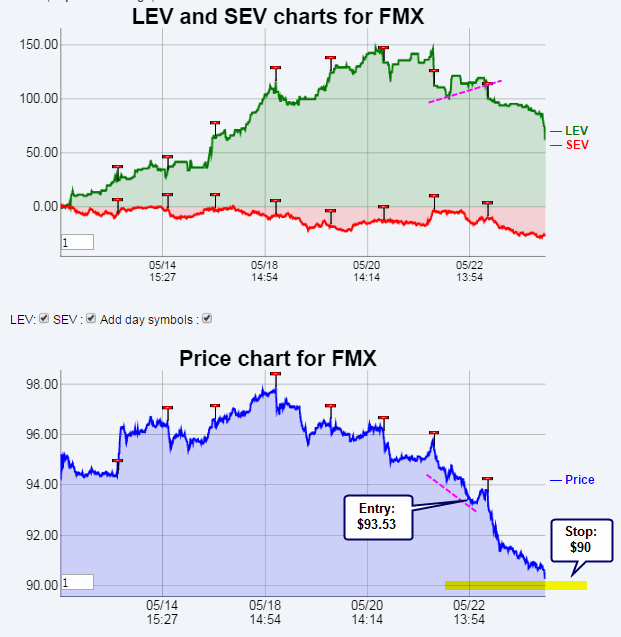
Pyramid data look pretty good. The LEV pattern shows that more buyers are coming in.
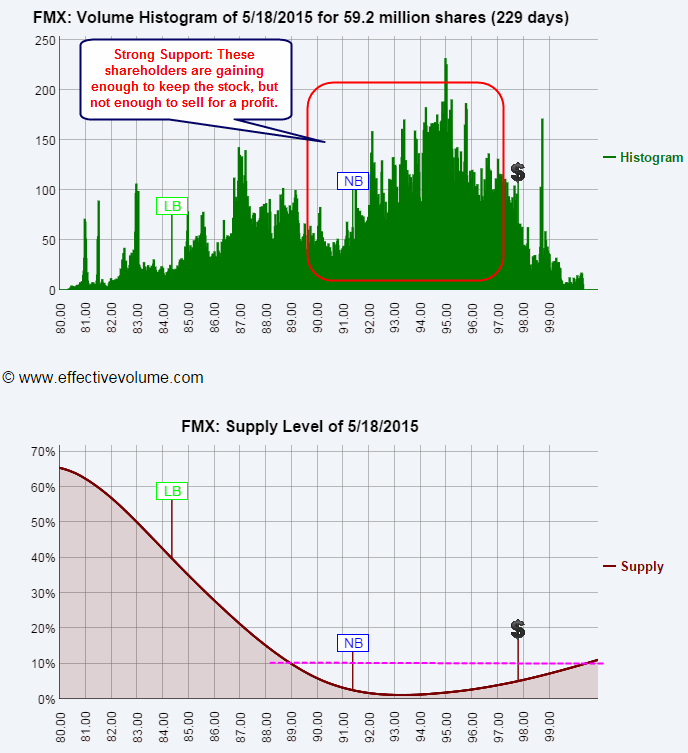
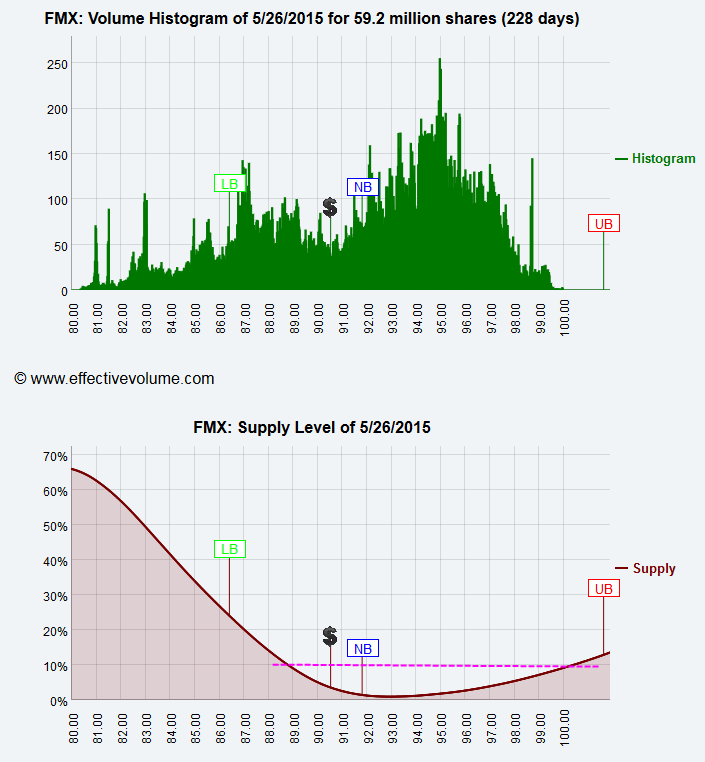
The Supply Figure tells us that not many traders want to sell here and most are waiting for higher prices.
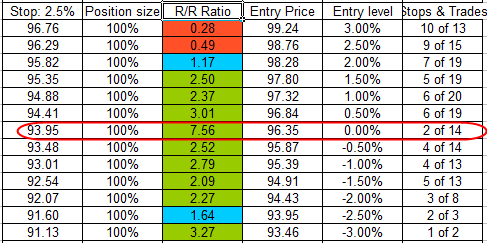
The ideal entry is around 96.35.
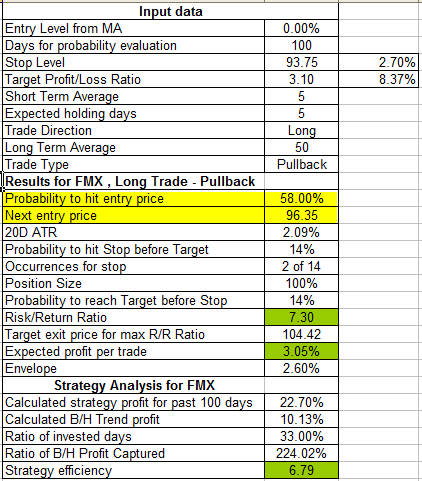
However, the buy zone is rather wide.
-
Hi,
Thanks for the idea, everything was green but it turns out to be a bad move. It dropped litteraly like a stone. Neither SMA20, SMA50, SMA200 (plotted on the chart below) saw a reaction of the price.
As a review exercice and to learn about that experience, care to explain what, for you, went wrong?

Thanks !
-
No problem to analyze this trade idea further.
As a reminder, FMX is a Coca Cola bottling and distributor in Mexico.
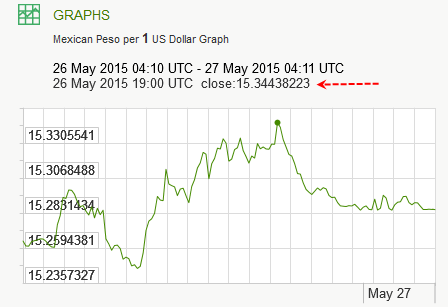
Yesterday, the markets were down 1%, Coca Cola was down 1%, but the most important is that the Mexico Peso was down 0.6% at the close. Since then, the Mexican Peso reversed. (Algos that are trading FMX have the Peso/US$ exchange rate factored in their decision making, together with the US equities trend and the Coca Cola price)
This long idea was suggested on May 20, at a price of about $96, but the sensitivity analysis of that day was showing an entry range between $93.46 and $97.8. I entered the trade on Friday at $93.53. We are now close to the $90 stop level.
The Supply Figure shows that we are still in a stable supply zone.
Now, I have to say that I do not decide on one trade idea independently from the Portfolio. When I started the day yesterday, the Portfolio was 40% long and 10% short. I ended the day with a 30% long and a 30% short position and the Portfolio lost less than 0.1% during the day. So, all in all, even though FMX lost yesterday, in the context of the Portfolio, the question is whether to respect the stop today or not.
We can see below that we are now in an oversold situation relative to the past 100 days uptrend.
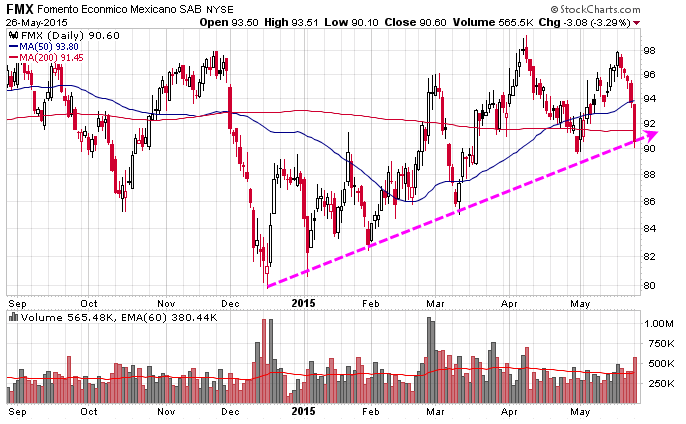
The Breakout Calculator stats measures of this particular trend tells us to buy on oversold condition. The hypothesis tested here is that the uptrend will hold. If the hypothesis is wrong (because the Peso collapses or the US market collapses, then the story will change and the hypothesis will be wrong.)
If the stock gaps below the stop, I will wait and see what happens before deciding on the trade. The Portfolio is neutral, the Mexico Peso bounced and the price is oversold. Also, I am not sure that the stock market is in a collapsing situation.
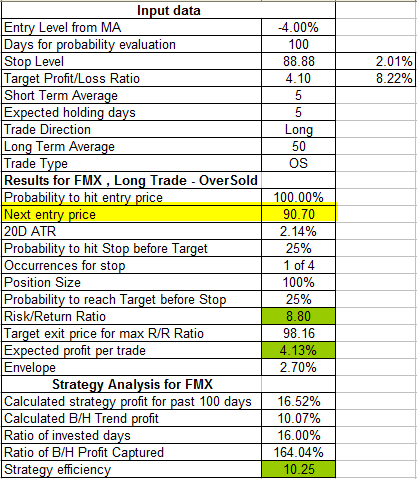
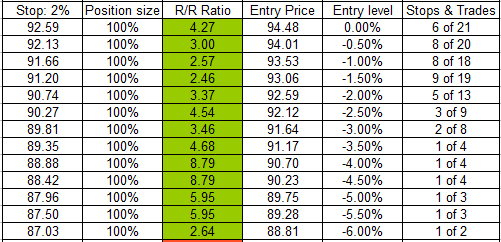
The data below tells us to buy with a stop at $88.88. Therefore, why sell here? Only if the up-trend hypothesis is wrong.
-
Crystal clear, it makes sense. Thank you for the detailled explanations.
 Posting Permissions
- You may not post new threads
- You may not post replies
- You may not post attachments
- You may not edit your posts
Forum Rules


 Reply With Quote