-
X
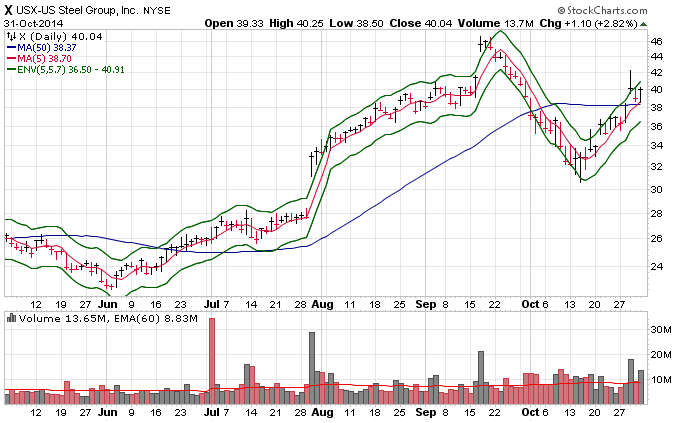
With the stock market breaking out, I have been looking at potential new short ideas, which are basically stocks that are bouncing into resistance. US Steel does not qualify, because it is above its 50MA and not in a resistance zone. However, it seems extended here.
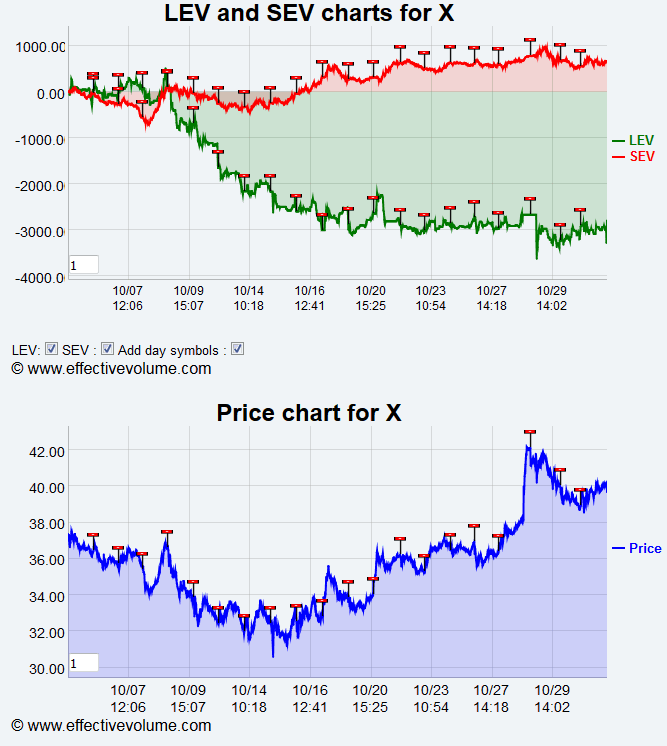
We can see below that the EV pattern looks poor: no buyers!
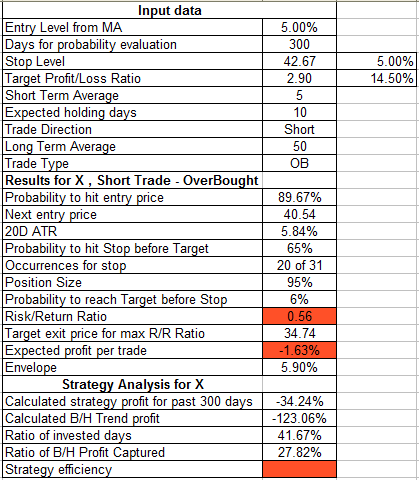
However, when I run the Breakout Calculator (BC) with the typical short settings, the results shown below are rather negative. This Table means that during the past 300 days, shorting X 5% above its 5MA (Extended) could not produce meaningful returns.
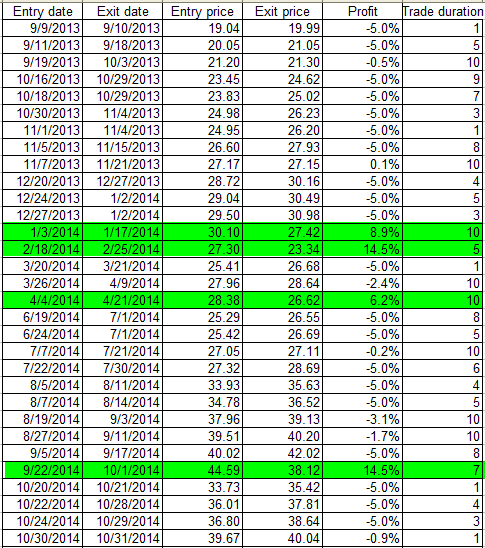
The list of trades generated is shown below. We can see that there are not many positive trades for this strategy.
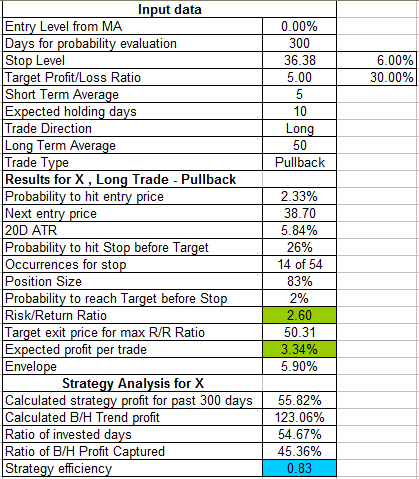
To the contrary, when we buy X on a pull-back to its 5MA, the probability table looks much better. This means that US Steel responded better to long than short trades and that as the market continues up, I believe that the stock will continue to better respond to long trades.
 Posting Permissions
- You may not post new threads
- You may not post replies
- You may not post attachments
- You may not edit your posts
Forum Rules


 Reply With Quote