-
The large effective ratio
Hi Pascal,
I am now involved in coding the Effective Ratio and, following your book (pages 128 and 129) I take the large effective volume, compute the rate of change (I assume your roc period is 2000 or 1000 depending on 5.3 or 3.3 days) then divide the Roc of LEV serie by the total shares volume in the same interval as the Roc period (2000 or 1000).
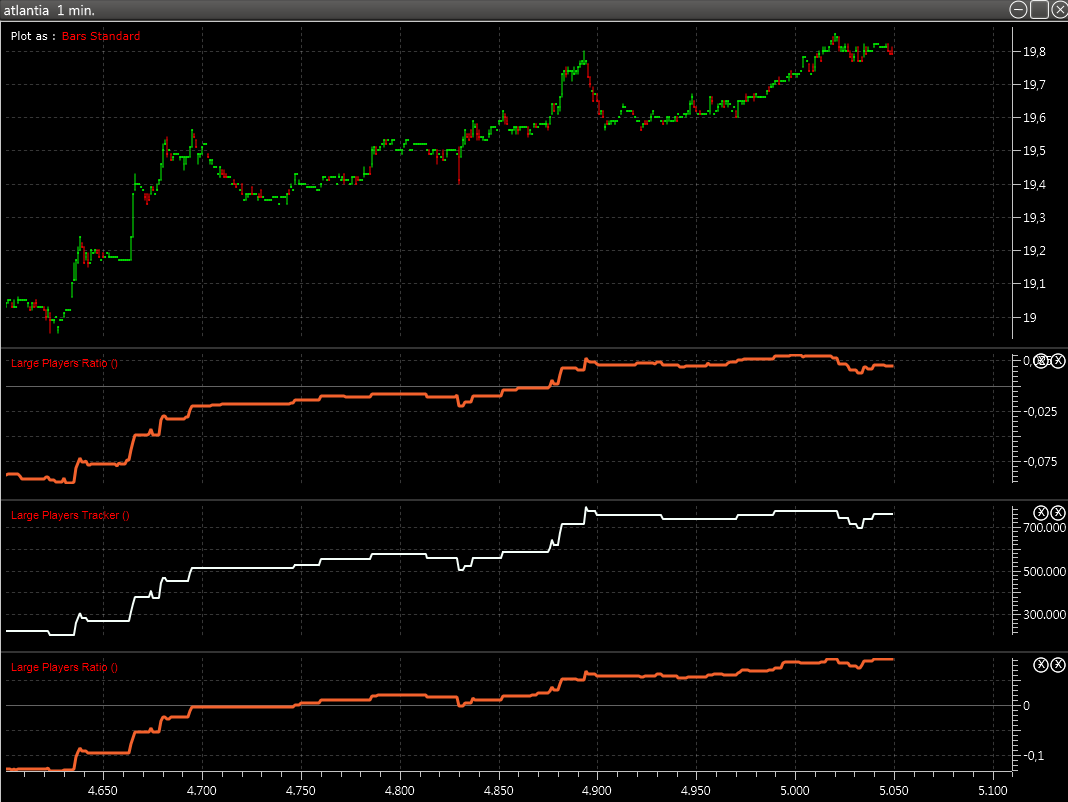
What I get is very similar to the Large effective volume serie, as from my picture below.
Is this correct or am I wrong somewhere?
P.S. LEV Roc series are plotted in orange unsmoothed, upper lev roc (1000) lower lev roc (2000), middle pane is Large effective volume
-
Seems good, but LER is an oscillator. It uses a rolling window.
Pascal
-
I am using a moving window (analysis window) as from your explanation, I was only concern for the similar path with the Large eff volume.
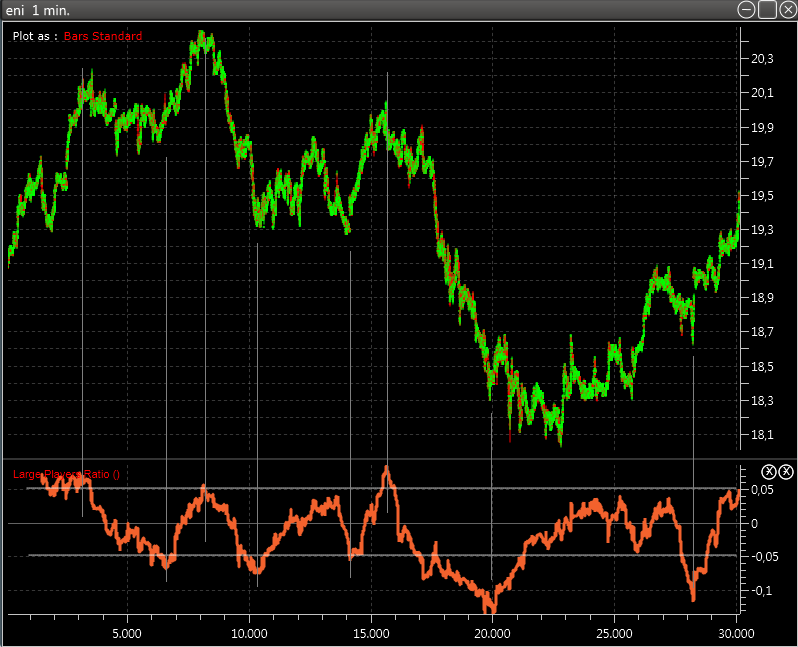
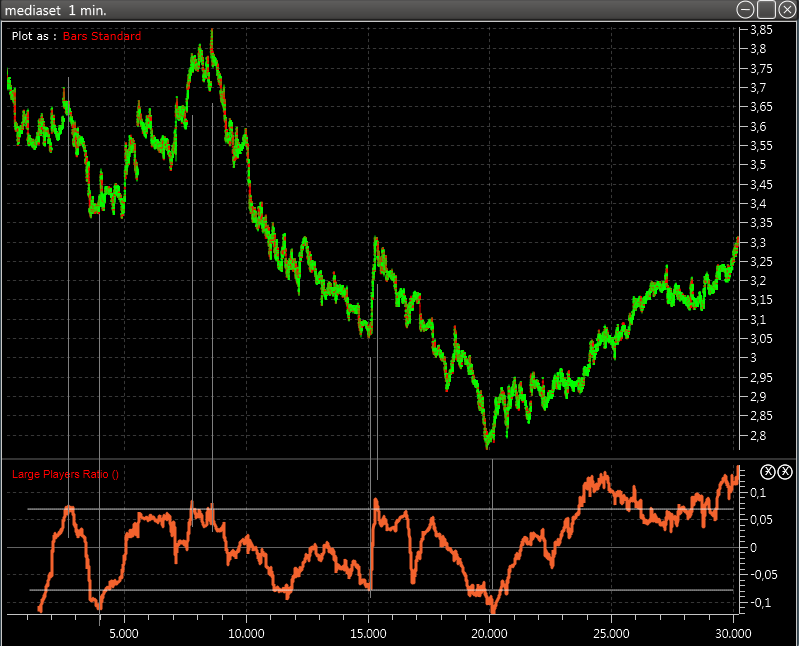
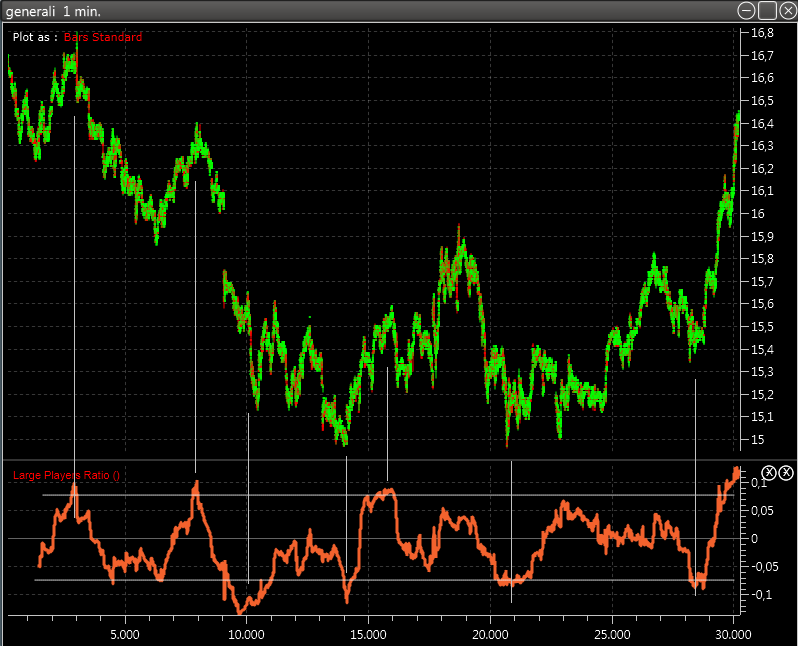
By the way these are some example of LER: I have noticed that usually LER pinpoint very well tops and bottoms, while it should indicate the opposite.
I wonder if I am wrong somewhere: can you post please a picture of a LER for the X serie (or any other you prefer) you provide previously?
Last edited by acepsut; 09-05-2014 at 03:39 AM.
Reason: Two more pictures added
-
Pascal,
one last question: in your book, pages 128 and 129 you suggest to take to rate of change from the large effective volume serie.
In the VIT forum archive
http://www.effectivevolume.com/showt...&highlight=NEV
I found you states that
LER is the difference
between large positive EV and large negative EV (divided by the total
volume).
So my question is: should I first create a serie from the difference of positive and negative LEV than compute the rate of change or you simply take the rate of change from the LEV serie?
Thanks
-
Good morning,
any help really appreciated.
Thanks
-
Your LER Figures seem to be correct.
95% of the time, LER will trend up with the price, because the price is going up when large players are buying.
What you are interested in is to find out the 5% when this does not occur and try to understand why.
There could be a good trading opportunity there.
Pascal
-
Hi Pascal,
thanks for your reply, I will study your 5% suggestion.
My LER is build starting from the LEV serie (ratio on LEV, then divide by volume), is this correct or should I
1) create a serie from the difference (positive LEV - negative LEV)
2) compute the ratio and divide by volume?
-
Acepsut,
You seem to be a nice guy, but I will not help you.
Unfortunately, I do not have the time to explain you in detail the hows and the whys of the LER. The VIT book explains it well enough for you to get on the right tracks.
Your latest questions tell me that you are not thinking this over. You just want to program and need technical assistance. I will not do the thinking for you. You are a developer and now I doubt that you are even a trader.
Please start with a simple question: "what do I want to measure?" If you can as a trader answer that question, then the developer will know what to do. You will think, you will test, you will back-test... you will rework again and again... you will do whatever is necessary.
I am more than happy to exchange over trading, over new ideas or anything that might interest me and other traders. Unfortunately, I have no time for the rest.
Pascal
-
Pascal, thanks for your reply.
You are right I am a developer and also a trader.
I am not asking you to support me for technical or developing question, my question about LER was only because I found two different statement, one reading the VIT book and the other searching on this forum.
Pictures pages 128 and 129 tells to use the LEV ratio then divide by volume while on this forum you states to get the difference from positive and negative LEV, then divide by volume.
I am only a little bit confused about what to use, nothing more.
My best regards,
Alberto
-
Mr. Willain,
May I ask you another question? In your book in the chapter about Effective Ratio you wrote about calculating average value of peaks and troughs. Here is what I've got:
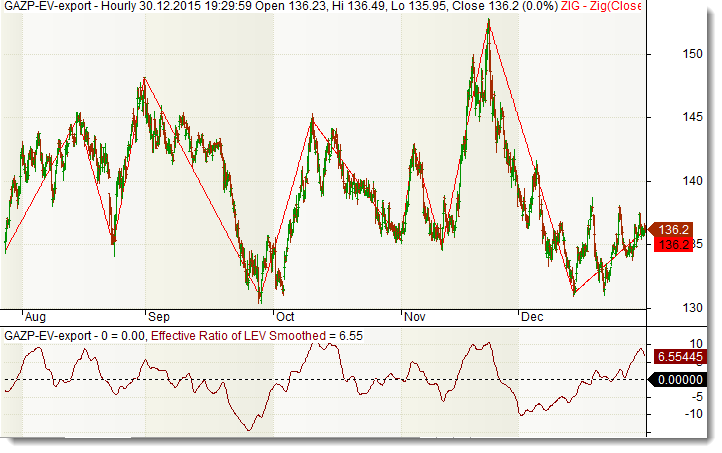
I made Effective Ratio Indicator (or at least I think I did), but how should I measure the peaks, for example? From lowest trough to trough, or from some intermediate one? And which peaks and troughs should I consider significant enough to use in calculations?
 Posting Permissions
- You may not post new threads
- You may not post replies
- You may not post attachments
- You may not edit your posts
Forum Rules


 Reply With Quote
