


Hi Pascal,
I wonder if you or any other LEV user have ever found a correlation between top or bottoms and LEV shares bought or sold.
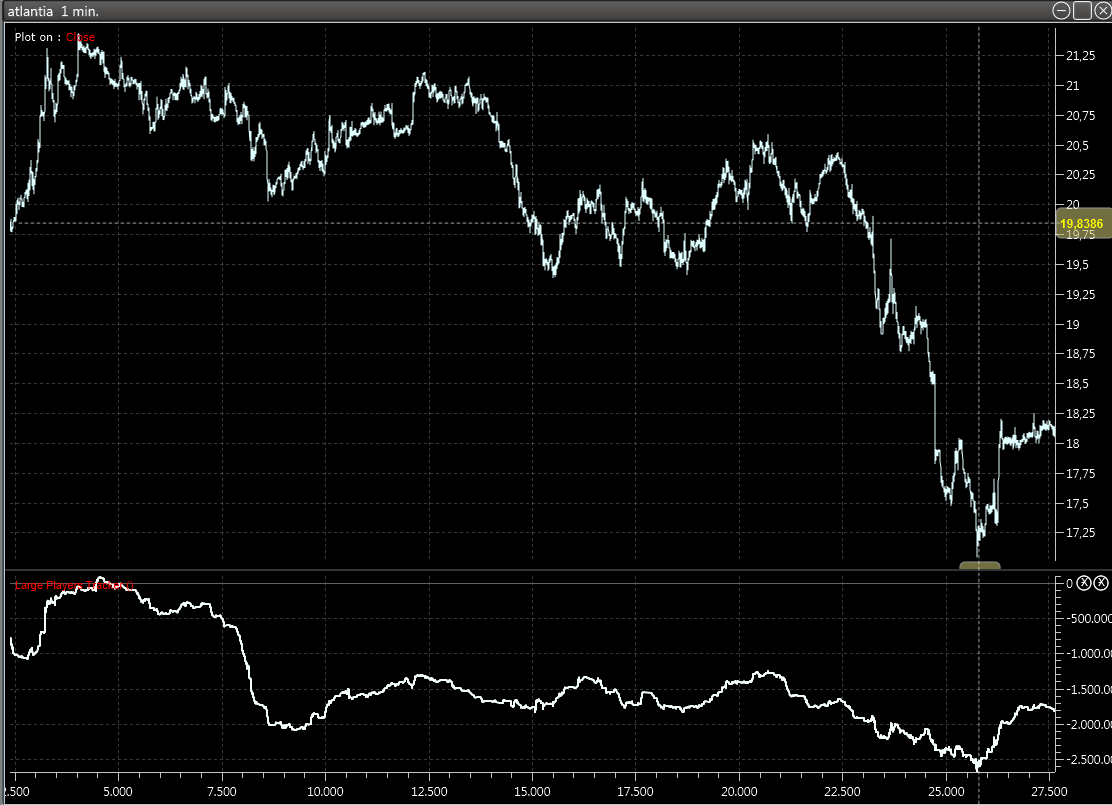
Looking at some stocks it seems that bottoms appears when LEV value is very low (I think it would be better to say "very low related as % of its float).
Does this makes sense? Below are some examples with 55 days plotted, each day is 505 minute.

 Reply With Quote