+ Reply to Thread
Results 1 to 2 of 2

Thread: LEV values extremes

  1. #1
    Join Date
    Mar 2013
    Location
    Reggio Emilia, Italy
    Posts
    24

    LEV values extremes

    Hi Pascal,

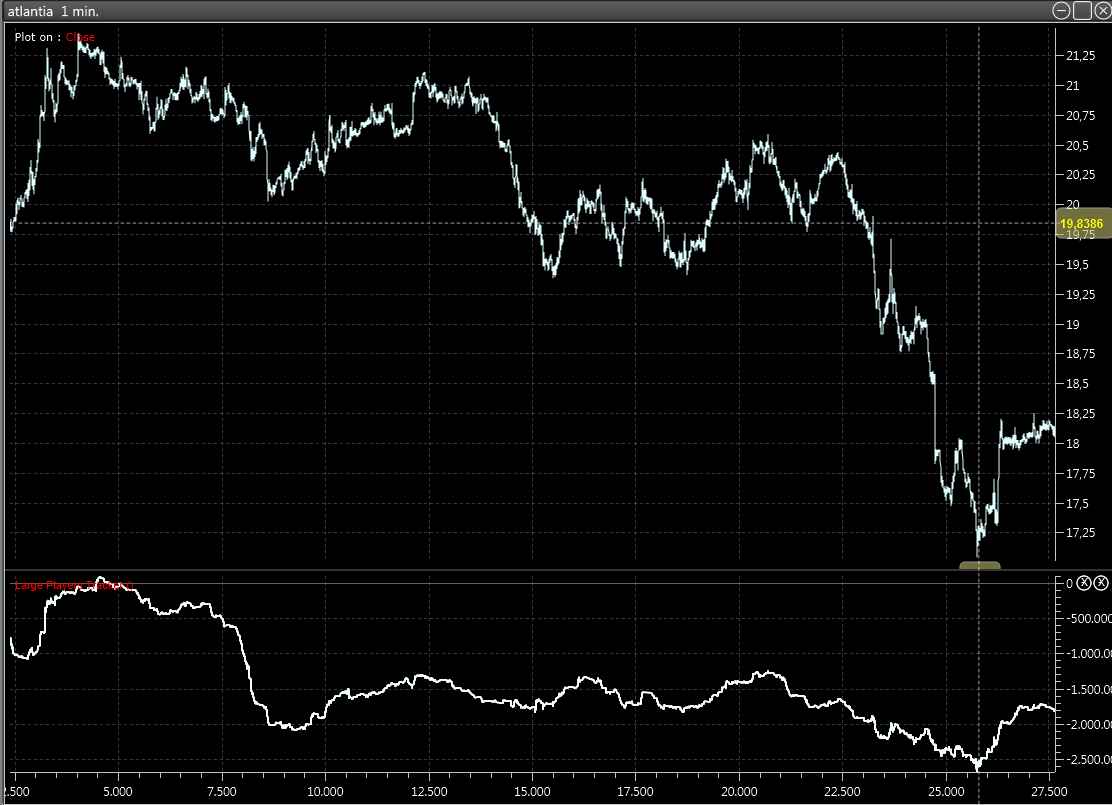
    I wonder if you or any other LEV user have ever found a correlation between top or bottoms and LEV shares bought or sold.

    Looking at some stocks it seems that bottoms appears when LEV value is very low (I think it would be better to say "very low related as % of its float).

    Does this makes sense? Below are some examples with 55 days plotted, each day is 505 minute.
    Name:  ZA762.png
Views: 218
Size:  66.7 KB

    Name:  ZA760.png
Views: 228
Size:  62.8 KB

    Name:  ZA761.png
Views: 230
Size:  60.3 KB

    Name:  ZA759.png
Views: 200
Size:  64.8 KB

  2. #2
    When there is a sell-off, LEV is usually negative, becuase there is "eagerness to sell."
    So yes, you van use extreme negative LEV levels as an indication for a possible oversold bounce.
    I would however prefer to then look at price.

    LEV is more interetsing to tell you when buyers come in after the price has fallen down and is still in a down trend.
    But please, do back-test these ideas for your market.


    Pascal

+ Reply to Thread

Posting Permissions

  • You may not post new threads
  • You may not post replies
  • You may not post attachments
  • You may not edit your posts