


Looks good indeed.
I filter with a 3MA. Looks better that way.
Pascal


Looks good indeed.
I filter with a 3MA. Looks better that way.
Pascal
Thanks, I will try to filter with a 3 period MA.Originally Posted by Pascal

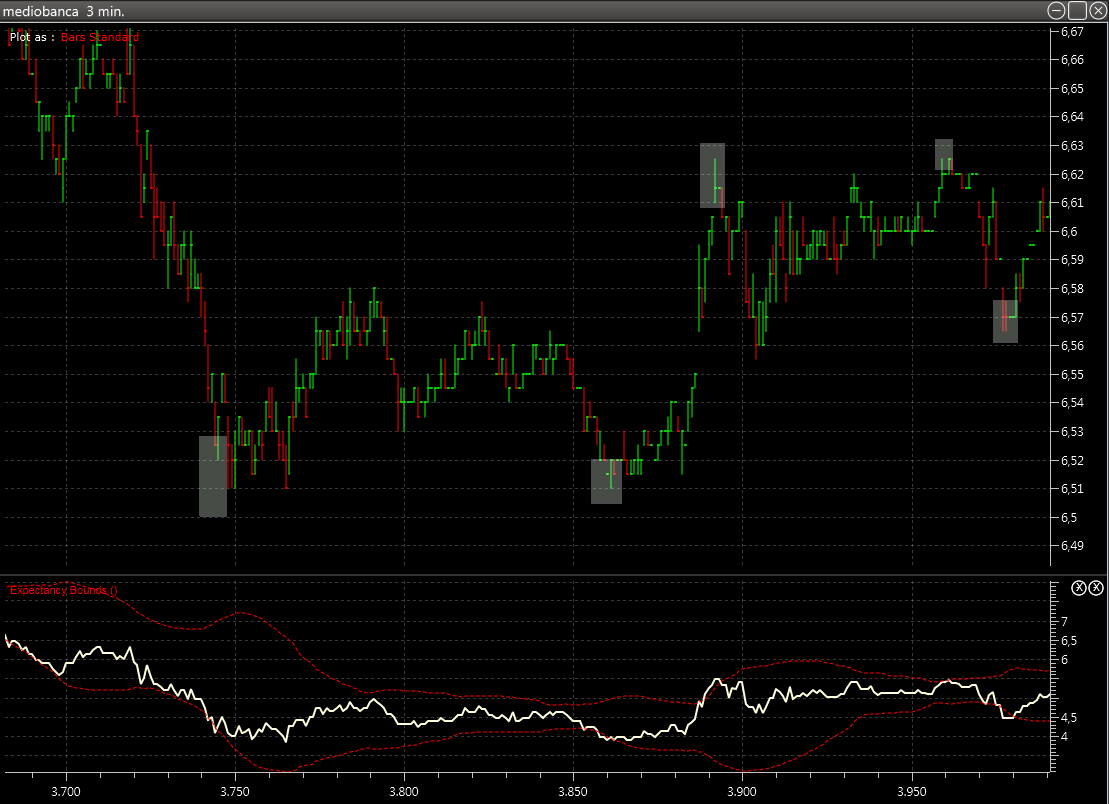
As a test, I have also added the Bollinger Bands: below are some entry signals based on the BB (50, 2.5).
Hi Pascal,
i'm also working on the indicators from your excelent book 'Value In Time'. Would be possible to get a picture of Effective Volume of minute data for the company X for the comparison purpose. I would be very greatfull.
Thanks
Jarek
Here it is
Pascal
Thanks a lot!
Even though I was able to download only last 15 days from Yahoo finance it looks good.
I'm trying to test your indicators on Polish market and have no full access to minute bars of the US stocks.
I would be double glad :) if you would attach the last 40days data of X to be sure :)
Regards
Jarek
here is the "X" data
Pascal
X_TMP.xls
Double thanks Pascal :)
My indicator looks good all the way.
Regards
Jarek
Thank you, Mr. Pascal Willain for explanation. Here is what I got (I made calculation of Active Boundaries using Python, and imported the result into Amibroker).
Congratulations!
I hope that this will help your trading. Active Boundaries are a valuation tool. This tool works well if used in a wider range of tools that can measure the trading ecosystem. This is at least what I try to do.
Pascal
Thank you! Thats what Im trying to do now. My current task is figuring out Effective Volume formula.
The data file you provided in the post # 16 was of a great help. Actually I had little problem with EV itself but have some difficulties with understanding how Separation Volume was chosen. Can you help me clear the situation?
I did everything according to textbook.
For example, lets have a look at one-day period on 06.08.2015. Total EV for that day was 5925757 shares. There were 353 trading minutes where EV was detected. Thus Separation Volume according to Average Separation Method would be 5925757 / 353 = 16787 shares. (I calculated it just for comparison).
To determine Separation Volume with Equi-Power Separation Method, I first arranged EV data in descending order and started to count running total until it was close to half of EV amount of that day (5925757 / 2 = 2962879 shares). On value of 24939 the running total was 2962810 which was pretty close to the goal. So I would say that Separation Volume should be some value between 24939 and next lower value in a row (which is 24631.38605). I chose 24938 as Separation Volume value.
Then I compared my SVS / LVS with those values in the data file. As you can see on the picture at 10:01:00 EV was lower than my Separation Volume value so this EV should have been added to your SVS running total. But as its shown on the screenshot, that value was added to your LVS (to be precise, it was subtracted, because it was negative value).
Tweaking the values, I found out that Separate Volume that was chosen by you, was something between 23546 and 23120.625. But it means that the pool of shares of the Large Effective Volume is bigger than the one of Small Effective Volume Analyzing other minutes I saw similar situation chosen Separation Volume value divided all shares unequally.
Why is that? Or maybe I missed something and my calculations are somewhere wrong? Thank you.
 Posting Permissions
 Reply With Quote