Watchlist Performance
Many of you indicated in a survey that Pascal took that your investing time frame is medium to longer term. Some of you know that I as a CANSLIM investor have a medium to longer term horizon and have been posting a watch list of CANSLIM high growth stocks in the stock selection portion of this site. Pascal provided me a tool that allowed me to estimate the historical performance of picks. I summarize some of it here.
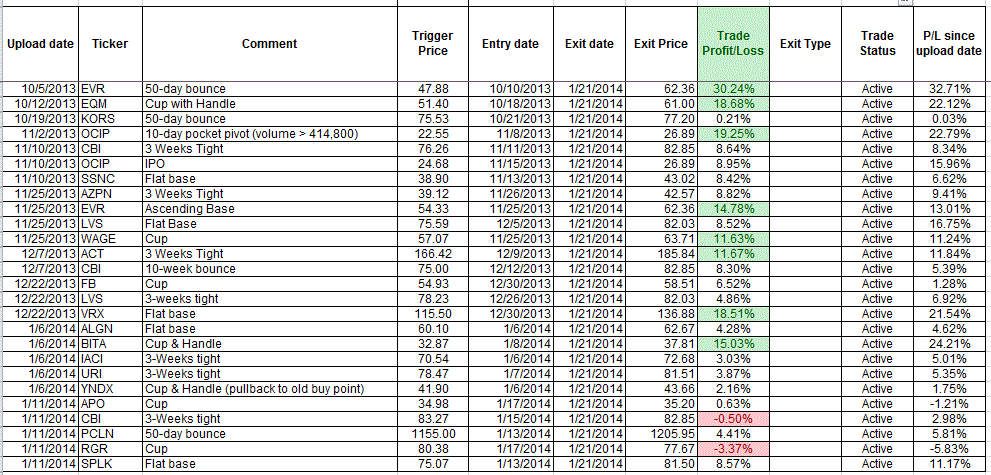
In general 71% of the long picks have ended up with gains or the positions are actively held with gains. Many of the positions are considered still active in the sense that they have triggered a buy signal and have yet to trigger a sell signal. I list the current active picks here along with the date the symbols were uploaded to the site, the date the buy trigger was activated and the Trade Profit/Loss to date. The active list of stocks are here:

The stock picks that have either stopped out at a loss or have triggered some other sell rule (often hitting a profit target) are here:

The normal stop loss for my portfolio is 7% of purchase cost. This is why there are many trades closed out at a 7% loss. The normal profit target for running my portfolio is 25% unless the stock is exhibiting very strong performance and then I look for ways to increase the profit target. In this analysis if the stock price after triggering a buy order closes below the 50-day moving average and then subsequently undercuts the lows of that day the stock is sold as it undercuts the low. Undercutting the 50-day moving average is usually a sign of pending failure.
Mike Scott
Cloverdale, CA


 Reply With Quote