+ Reply to Thread
Results 1 to 3 of 3

Thread: Supply Tool Upgraded

  1. #1

    Supply Tool Upgraded

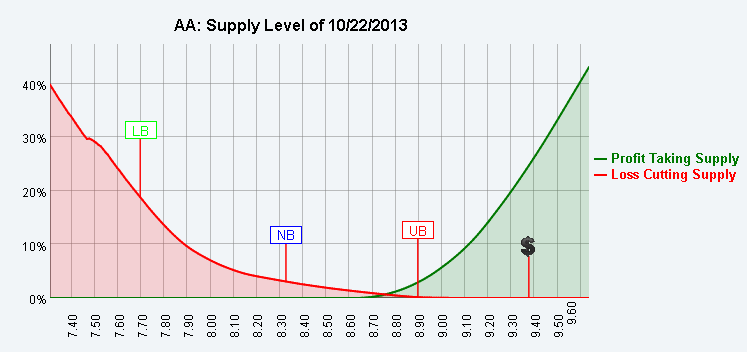
    We just upgraded the Supply tool, in order to separate the loss cutting selling activity from the profit taking selling activity.

    Loss cutting activity is usually more violent and could quickly push prices down.
    NFLX is in great danger here (just at 10%.) GRPN went under (Supply much higher than 10%) , but AA is doing fine (Supply higher than 10%, but in the green zone. This means "buy on a pull back to $9., the 10% level")


    Pascal
    Name:  NFLX_S.gif
Views: 211
Size:  15.7 KBName:  GRPN_S.gif
Views: 198
Size:  15.2 KBName:  AA_S.gif
Views: 206
Size:  15.0 KB

  2. #2
    Join Date
    Aug 2011
    Location
    San Antonio, TX USA
    Posts
    9

    Ideal Buy Point

    Is the best buy point at the 10% line for any given stock or at the cross of the two curves at the bottom?

  3. #3
    Quote Originally Posted by JoeLo View Post
    Is the best buy point at the 10% line for any given stock or at the cross of the two curves at the bottom?
    Joelo,


    The Supply figure shows how eager shareholders are to sell their stock depending on the price.
    Whenever the supply is lower than 10%, it means that few shareholders are ready to sell. The lower the supply Figure, the better.

    This Supply level must be combined to the EV pattern. If you see a strong stock that is pulling back in price back down to the <10% supply level with EV showing that large players are not selling, then there is a good probability that the price will bounce.

    You can see below that CIEN and DRI are showing this type of patterns.


    Pascal

    Name:  CIEN_EV.gif
Views: 163
Size:  33.6 KBName:  CIEN_S.gif
Views: 169
Size:  25.4 KB

    Name:  DRI_S.gif
Views: 134
Size:  27.9 KBName:  DRI_EV.gif
Views: 166
Size:  29.8 KB

+ Reply to Thread

Posting Permissions

  • You may not post new threads
  • You may not post replies
  • You may not post attachments
  • You may not edit your posts