-
10/5/2013 Mousetrap
Sector Model XLK -0.01%
Large Portfolio Date Return Days
ABX 4/11/2013 -25.31% 177
TTM 5/6/2013 9.11% 152
BTI 7/1/2013 1.12% 96
VAR 8/2/2013 2.38% 64
OUTR 8/19/2013 -8.65% 47
QCOM 9/3/2013 2.63% 32
FLR 9/16/2013 6.93% 19
GCO 9/24/2013 5.85% 11
NEM 9/30/2013 -4.22% 5
BCR 10/4/2013 0.81% 1
(Since 5/31/2011)
S&P Annualized 9.89%
Sector Model Annualized 23.83%
Large Portfolio Annualized 29.12%
From: http://market-mousetrap.blogspot.com...t-returns.html
Rotation: selling GCO; buying BAX.
BAX was my target a few days ago, and its back. Well see if I have better luck on Monday.
In any case, today Id like to talk about something that even sophisticated traders lose sight of: REAL RETURNS.
Real returns are the returns you are left with after trading costs, taxes, and management fees. Any time you get a report from your management firm that only talks about gross returns" and not returns "net of fees, RUN. Dont walk, RUN. Pull your money out of there and flee as fast as possible.
The only returns that matter are net returns, after every bloodsucker takes a bite out of YOUR retirement money.
For instance, here is the sector model with gross versus net returns:
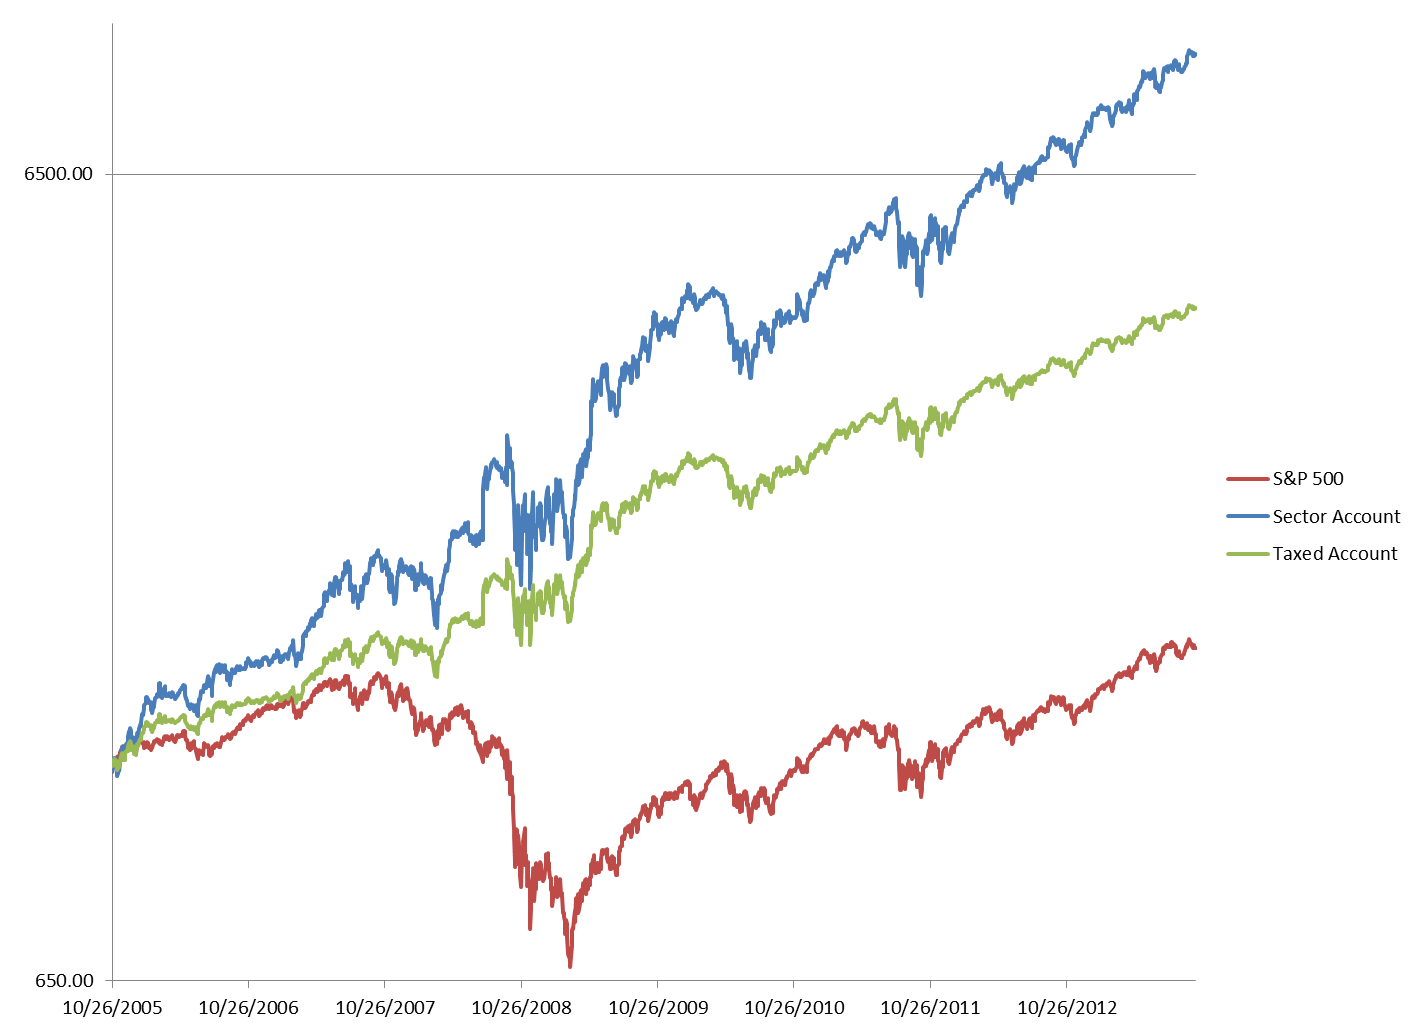
The red line is the S&P500.
The blue line is gross returns on the (revised) sector model.
The green line is NET returns, after taxes.
The green line is all that matters. Mutual funds and other managed accounts try to report gross returns, but gross returns are NOT what you get. You cant retire off of money you give away through taxes and fees.
Even if you were to simply hold SPY and never sell until you retire, you will STILL have to pay long term capital gains whenever you cash out. The difference between gross and net affects even those who simply hold index funds:
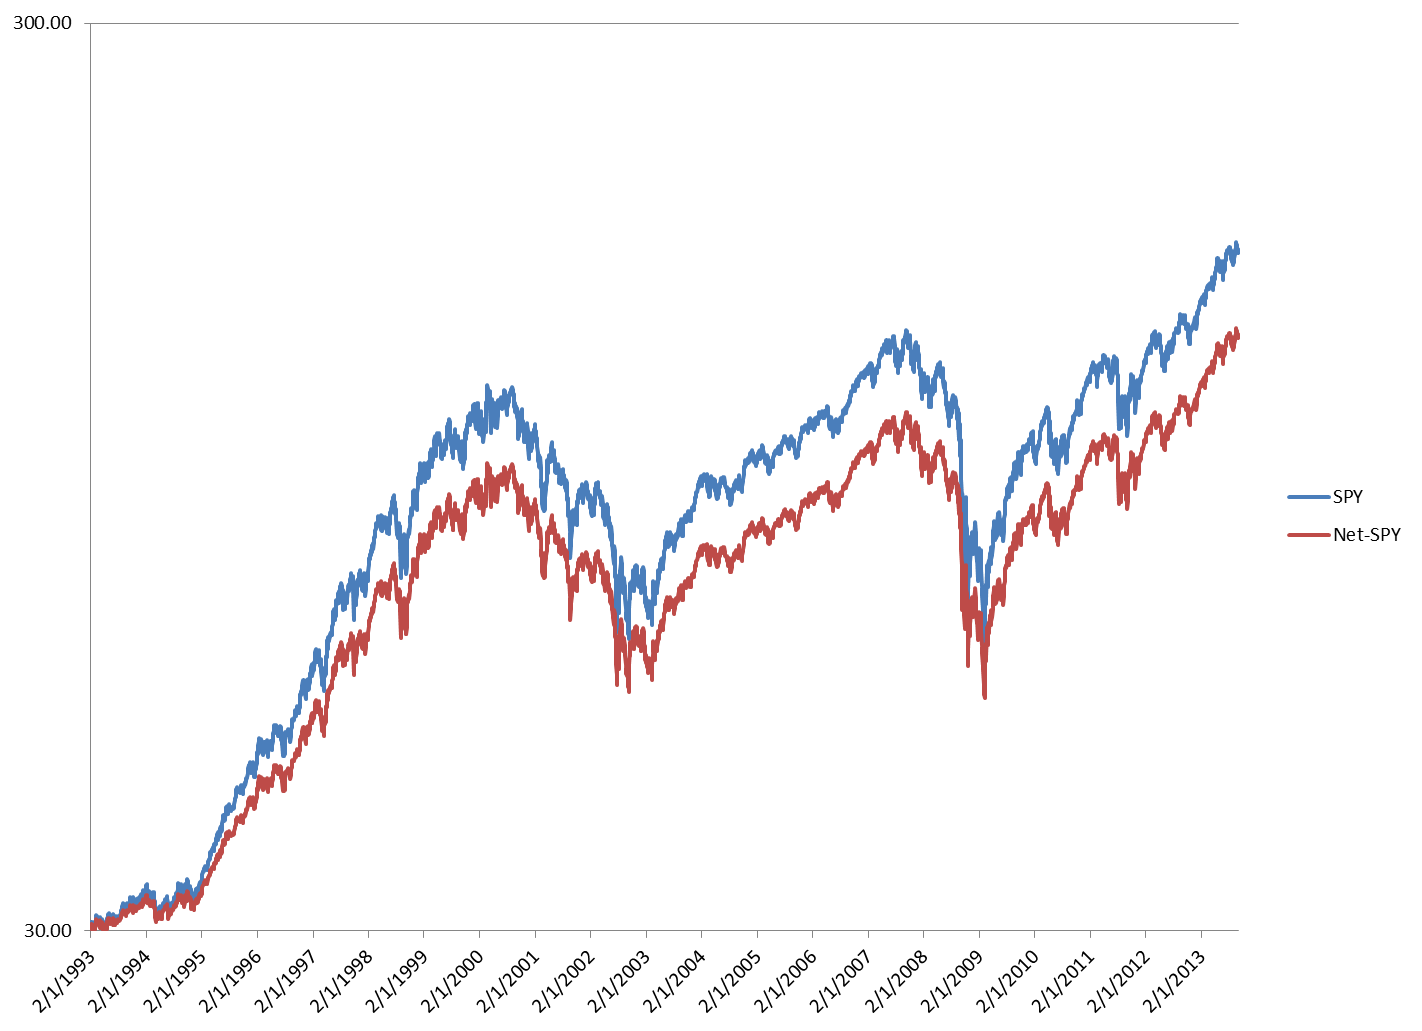
Gross SPY is in blue.
Net SPY is in red. It is always 23.8% lower when you cash out.
So then, the question arises, just how much do you need to outperform (gross) before you ACTUALLY outperform (net)? For most folks, even if they appear to outperform SPY, theyll still end up with less than they would have if they had simply parked in SPY and forgotten about managed accounts.
Lets say you have a managed account that rotates your stocks at least once a year and charges you 10% of the profit. Youll pay 43.8% in taxes, and another 10% in fees.
Lets just round it to an even 50% to make it easy.
Basically you have to DOUBLE the performance of SPY in order to BREAK EVEN.
Anything less than double typical SPY returns, and you are losing money.
Is your financial planner doubling SPY every year?
Ask them.
Get hard numbers and double check them yourself. If they get wishy washy on the answers, or they try to misdirect you with talk of gross returns, run.
If they talk about risk adjusted returns and you have ten years or more until you retire, run.
Granted, thats my opinion, and Im not qualified to give financial advice.
But YOU are qualified to get real answers about real returns on your real money, and YOU are qualified to pull out a calculator and compare your results against SPY.
Its YOUR money
unless you give it away.
Tim
Last edited by Timothy Clontz; 10-06-2013 at 09:17 AM.
-
10/11/2013 rotation
Sector Model XLK -0.09%
Large Portfolio Date Return Days
ABX 4/11/2013 -26.10% 183
TTM 5/6/2013 15.09% 158
BTI 7/1/2013 2.38% 102
VAR 8/2/2013 5.70% 70
OUTR 8/19/2013 0.16% 53
QCOM 9/3/2013 0.84% 38
FLR 9/16/2013 6.74% 25
NEM 9/30/2013 -6.00% 11
BCR 10/4/2013 0.96% 7
BAX 10/7/2013 1.46% 4
(Since 5/31/2011)
S&P Annualized 10.20%
Sector Model Annualized 23.17%
Large Portfolio Annualized 29.79%
From: http://market-mousetrap.blogspot.com...-rotation.html
Rotation: selling OUTR; buying BDX.
As always, an unfavorable gap between the two will prevent the trade.
Tim
 Posting Permissions
- You may not post new threads
- You may not post replies
- You may not post attachments
- You may not edit your posts
Forum Rules


 Reply With Quote